Fig. 9.
Download original image
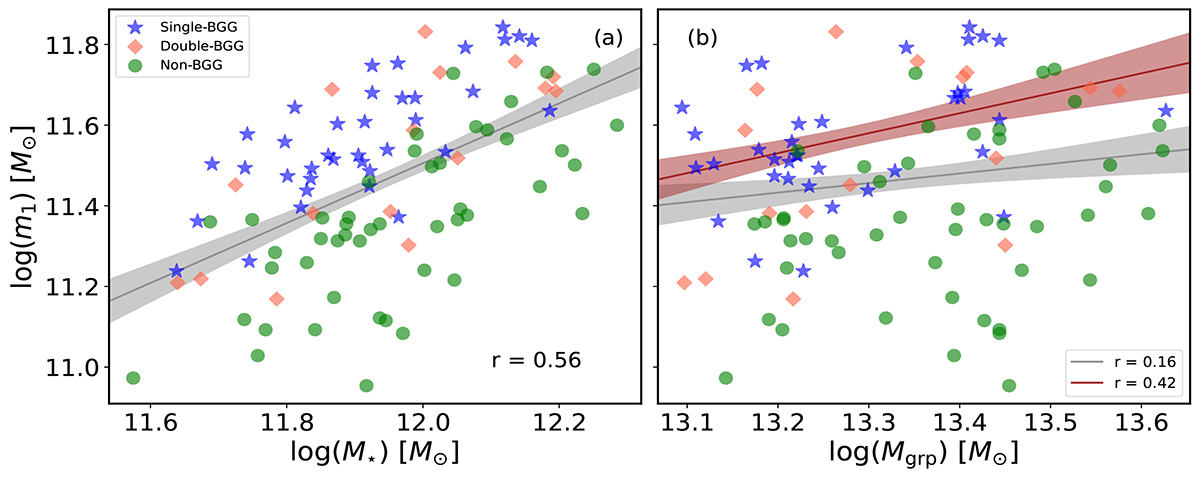
Same as Fig. 7, but for m1 against (a) the total stellar mass (M⋆) and (b) the total system mass (Mgrp). The additional solid brown line and shaded band in panel b represent the linear fit and its associated uncertainty derived from the moderately strong positive linear correlation (r = 0.42) between log(m1) and log(Mgrp), calculated after excluding non-BGG groups.
Current usage metrics show cumulative count of Article Views (full-text article views including HTML views, PDF and ePub downloads, according to the available data) and Abstracts Views on Vision4Press platform.
Data correspond to usage on the plateform after 2015. The current usage metrics is available 48-96 hours after online publication and is updated daily on week days.
Initial download of the metrics may take a while.