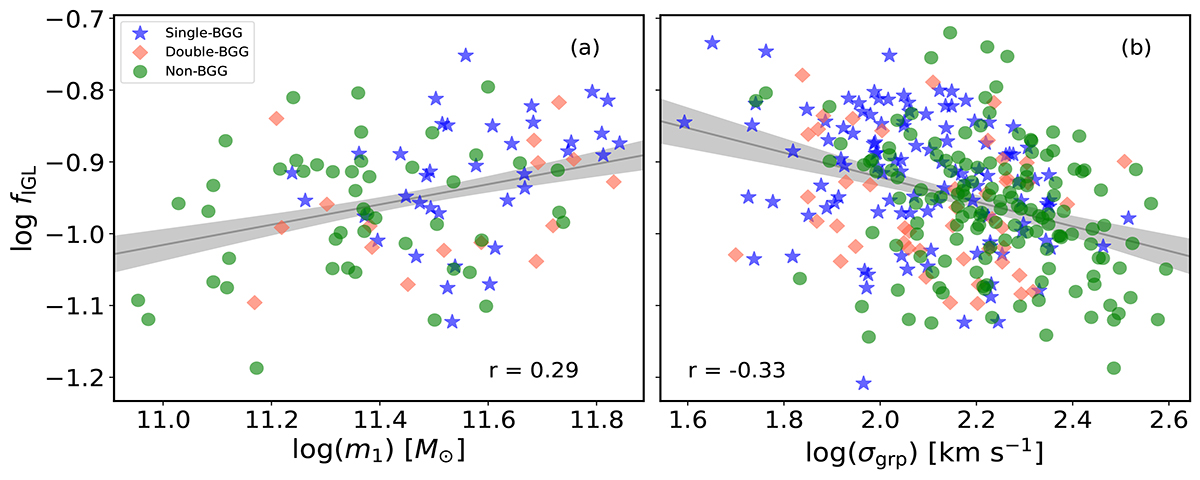
Fig. 8.
Download original image
Same as Fig. 7, but for the correlation of fIGL with (a) the mass of the first-ranked galaxy (m1) and (b) the internal velocity dispersion of the groups (σgrp). Unlike the correlations depicted in panel a and in Figs. 6 and 7, each group in panel b is represented by three points, corresponding to three independent measurements on the Cartesian planes.
Current usage metrics show cumulative count of Article Views (full-text article views including HTML views, PDF and ePub downloads, according to the available data) and Abstracts Views on Vision4Press platform.
Data correspond to usage on the plateform after 2015. The current usage metrics is available 48-96 hours after online publication and is updated daily on week days.
Initial download of the metrics may take a while.