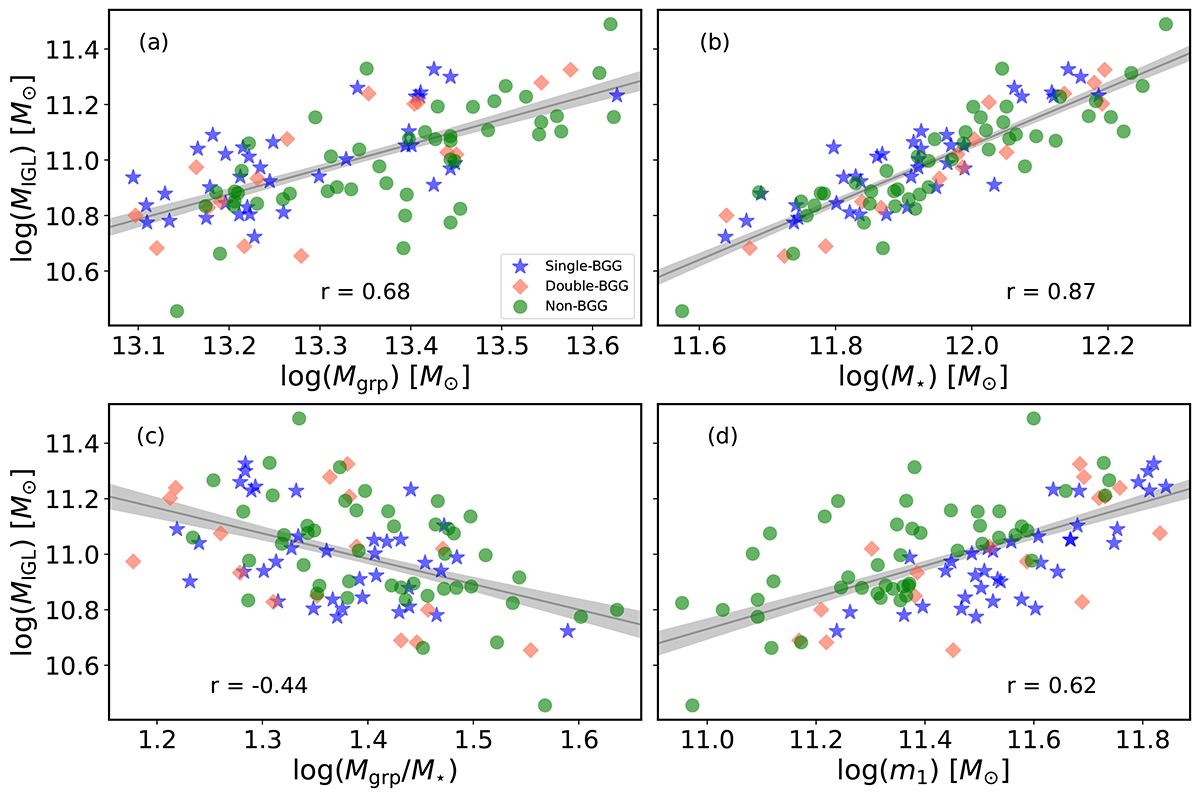
Fig. 7.
Download original image
Scatter plots of MIGL against the four group properties with which this parameter is more strongly correlated, all measured at z = 0 (see Table 3). These properties are: (a) total system mass (Mgrp), (b) total stellar mass (M⋆), (c) total mass-to-stellar mass ratio (Mgrp/M⋆), and (d) mass of the first-ranked galaxy (m1). Symbols for data points correspond to those used in Fig. 6. Since the values of all four properties are unaffected by the viewing direction, we only include, for the sake of clarity, the data points corresponding to the projections onto the XY plane. The solid grey lines and shaded bands represent the linear relationships and the associated 1σ uncertainties for each pair of parameters. The corresponding values of the Pearson correlation coefficients, r, are provided in each panel.
Current usage metrics show cumulative count of Article Views (full-text article views including HTML views, PDF and ePub downloads, according to the available data) and Abstracts Views on Vision4Press platform.
Data correspond to usage on the plateform after 2015. The current usage metrics is available 48-96 hours after online publication and is updated daily on week days.
Initial download of the metrics may take a while.