Fig. 6.
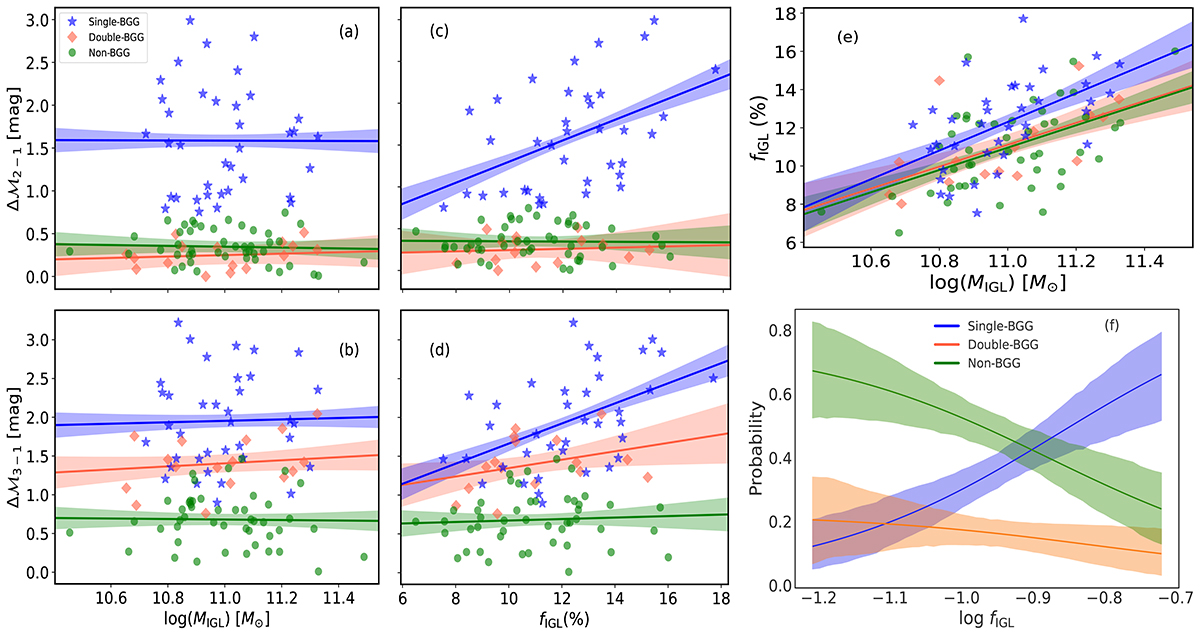
Download original image
Logarithm of the IGL mass (a)–(b) and IGL fraction (c)–(d) plotted, respectively, against the Δℳ2−1> and Δℳ3−1> magnitude gaps of the BGG. (e) IGL fraction vs. the logarithm of the IGL mass. In panels (a)–(e) blue stars represent single-BGG groups (for which Δℳ2−1> ≥ 0.75 mag), orange diamonds double-BGG groups (Δℳ2−1> ≤ 0.5 mag and Δℳ3−2> ≥ 0.75 mag), and green circles non-BGG groups (both Δℳ2−1> and Δℳ3−2> are less than 0.75 mag, indicating the absence of a clearly dominant BGG). The solid lines and shaded bands in these panels illustrate, following the same colour scheme, linear fits and their associated uncertainties for each BGG subset. The fits are included to highlight the moderately strong positive linear correlation (Pearson coefficients r = 0.46 and r = 0.49, respectively) that exists between fIGL and Δℳ2−1> and Δℳ3−1> for the single-BGG group subset (panels c and d), as well as the mild positive relationship (r = 0.33) observed between fIGL and Δℳ3−1> for the double-BGG group subset (panel d). Since the magnitude gaps are view-independent, data in all these panels are limited to single-axis projections of the z = 0 snapshots for the sake of clarity, showing only measurements in the XY plane. (f) Same as Fig. 5, but for the IGL fraction at z = 0. In this case, the probabilities are derived from the 300 measurements of fIGL obtained using the three orthogonal projections.
Current usage metrics show cumulative count of Article Views (full-text article views including HTML views, PDF and ePub downloads, according to the available data) and Abstracts Views on Vision4Press platform.
Data correspond to usage on the plateform after 2015. The current usage metrics is available 48-96 hours after online publication and is updated daily on week days.
Initial download of the metrics may take a while.