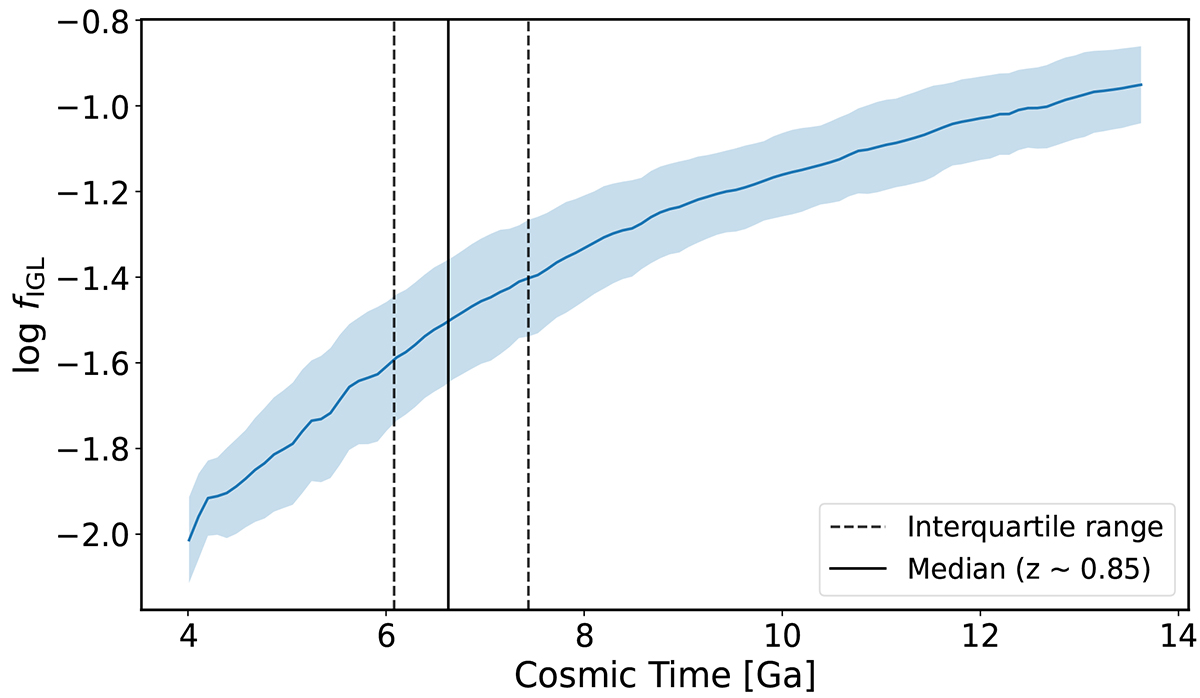
Fig. 3.
Download original image
Growth of the IGL fraction over cosmic time in our simulated groups. The blue band represents the interquartile range of the temporal variation in the distribution of log(fIGL) in the last ∼10 Ga of the runs, with the central solid line indicating the evolution of the median value. The vertical solid and dashed lines mark, respectively, the Q2, and Q1 and Q3 quartiles of the distribution of turnaround times, when the groups reach their largest non-expanding scale around the centre of gravity.
Current usage metrics show cumulative count of Article Views (full-text article views including HTML views, PDF and ePub downloads, according to the available data) and Abstracts Views on Vision4Press platform.
Data correspond to usage on the plateform after 2015. The current usage metrics is available 48-96 hours after online publication and is updated daily on week days.
Initial download of the metrics may take a while.