Open Access
Fig. 8
Download original image
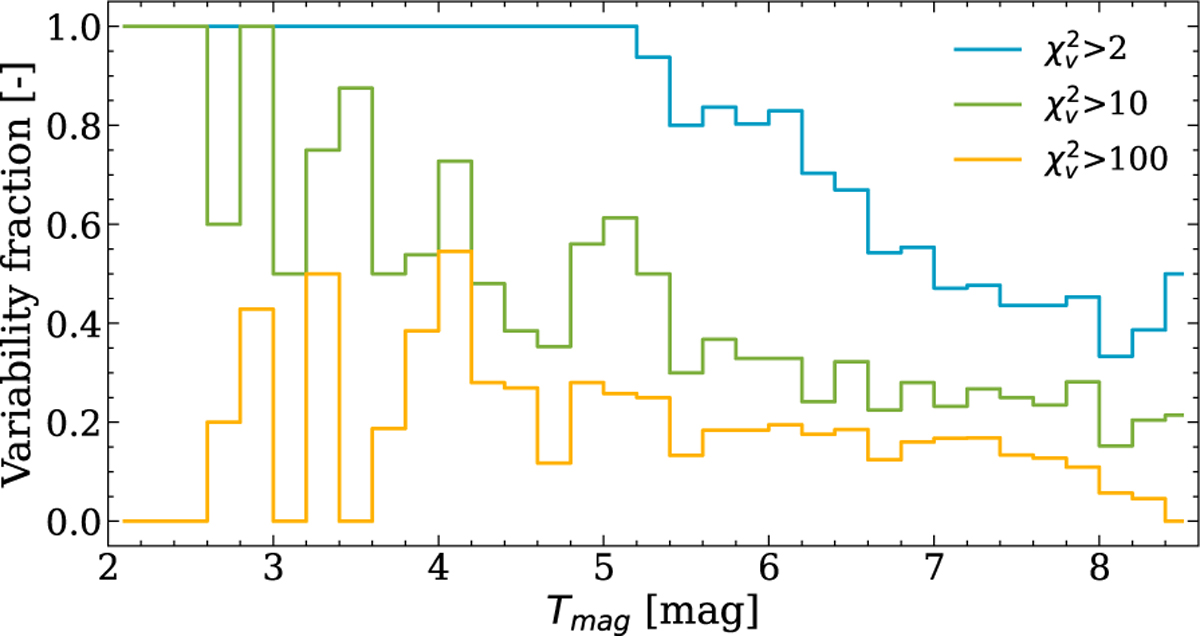
Variability fractions of the stars in the calibrator candidate sample as a function of magnitude. Following Ciardi et al. (2011), the blue curve represents the fractions of stars with ![]() , the green curve the fractions of stars with
, the green curve the fractions of stars with ![]() , and the orange curve the fractions of stars with
, and the orange curve the fractions of stars with ![]() .
.
Current usage metrics show cumulative count of Article Views (full-text article views including HTML views, PDF and ePub downloads, according to the available data) and Abstracts Views on Vision4Press platform.
Data correspond to usage on the plateform after 2015. The current usage metrics is available 48-96 hours after online publication and is updated daily on week days.
Initial download of the metrics may take a while.