Open Access
Fig. 6
Download original image
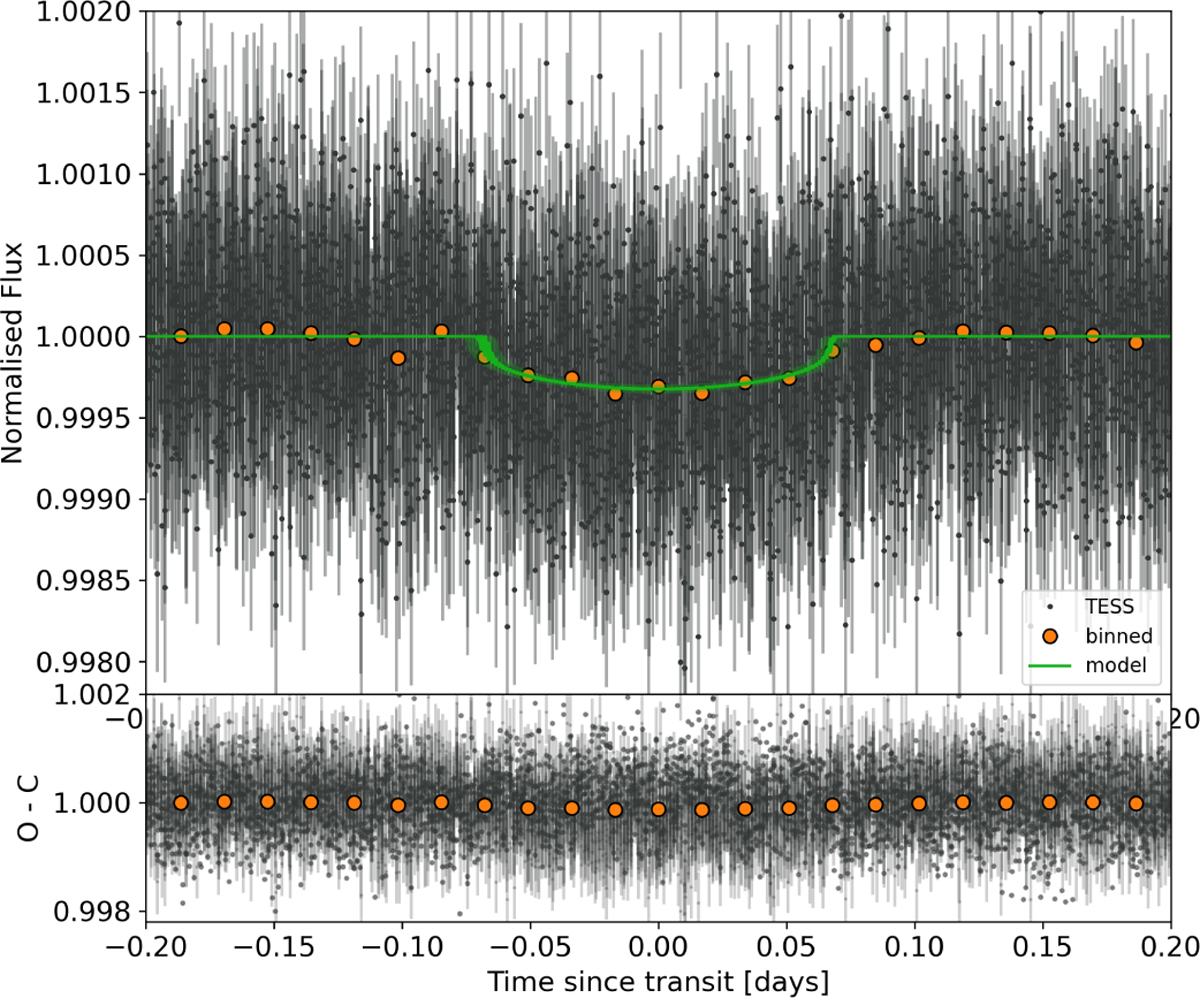
Top: phase-folded TESS light curve of TOI-512 at the period P = 7.18886 days. Black dots represent TESS 2-min cadence data. For clarity, we plot the binned light curve in big orange dots. The solid green line and overlay correspond to our best-fit solution and its relative 1σ uncertainty.
Current usage metrics show cumulative count of Article Views (full-text article views including HTML views, PDF and ePub downloads, according to the available data) and Abstracts Views on Vision4Press platform.
Data correspond to usage on the plateform after 2015. The current usage metrics is available 48-96 hours after online publication and is updated daily on week days.
Initial download of the metrics may take a while.