Fig. 3
Download original image
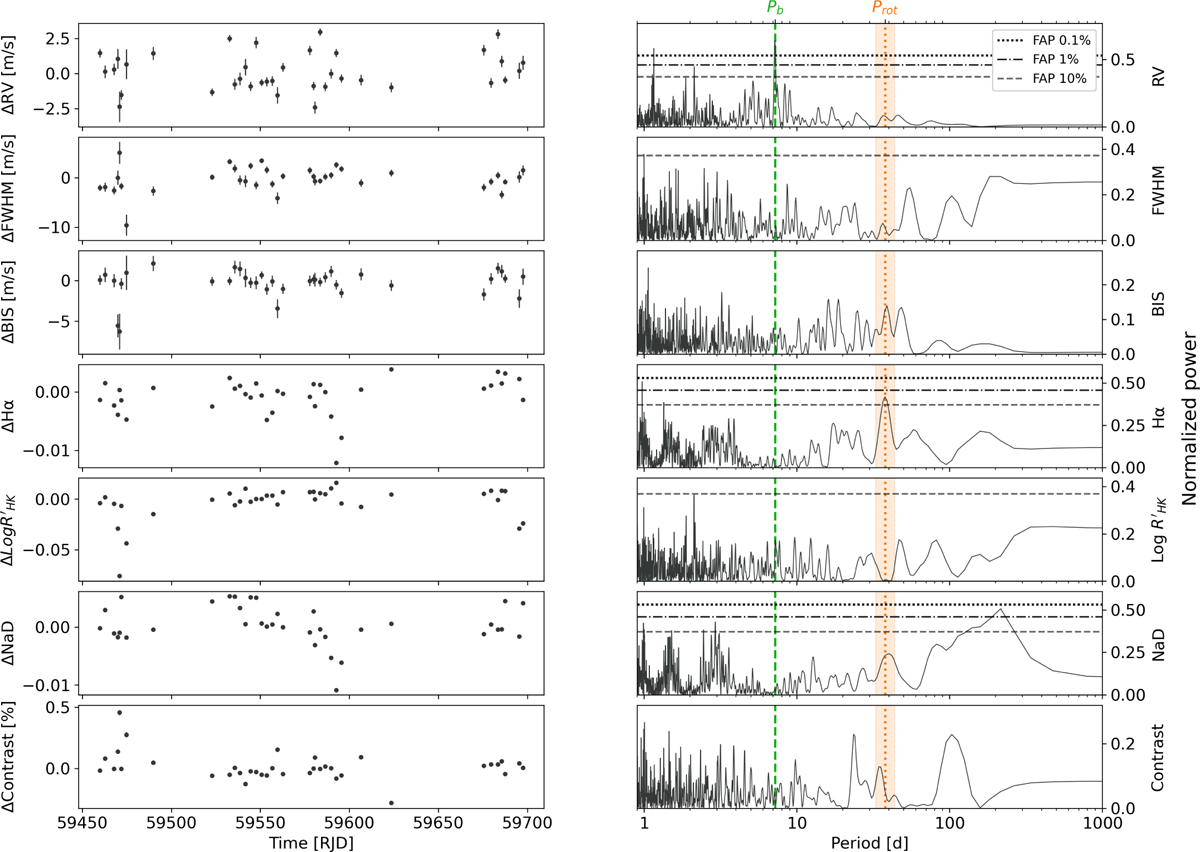
Left panel: time series of the RV observations and spectroscopic activity indicators presented in Sect. 2.3. Right panel: GLS periodograms of the RV and activity indicators’ timeseries. Horizontal lines represent the 0.1%, 1%, and 10% false alarm probability (FAP) derived following Baluev (2008). The green dashed vertical line represents the period of TOI-512b. The orange dotted vertical line represents the stellar rotational period from Suárez Mascareño et al. (2015).
Current usage metrics show cumulative count of Article Views (full-text article views including HTML views, PDF and ePub downloads, according to the available data) and Abstracts Views on Vision4Press platform.
Data correspond to usage on the plateform after 2015. The current usage metrics is available 48-96 hours after online publication and is updated daily on week days.
Initial download of the metrics may take a while.