Fig. 8

Download original image
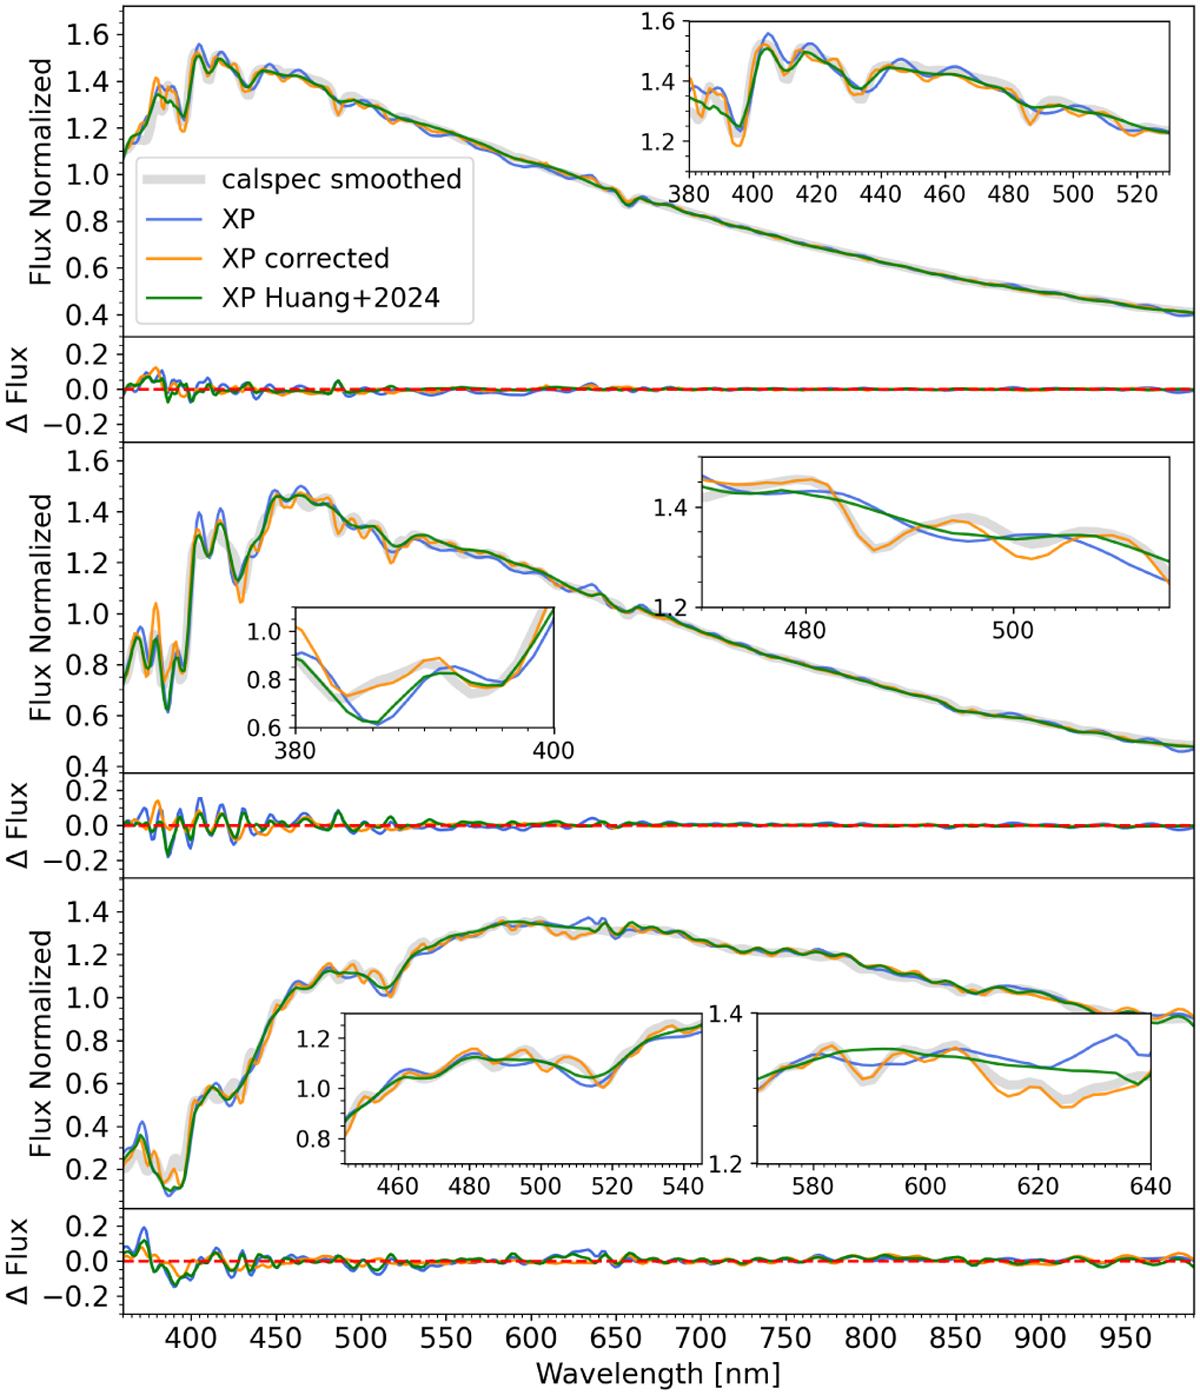
Examples of how pattern correction can help improve the fitting between the XP spectra and the CALSPEC. Three spectra with different temperatures are presented in the sub-panels, from top to bottom: BD+54 1216, HD 115169, and KF06T2 in CALSPEC. In each panel, the smoothed CALSPEC spectrum is depicted as a bold gray line, while the XP spectra, with and without correcting patterns, are shown in blue and orange, respectively. The green lines show the corrected spectra using the package provided by Huang et al. (2024a). To enhance readability, we include a few zoomed-in diagrams in each panel to highlight the improvements on spectrophotometry. The ∆Flux between XP and CAL- SPEC are also presented at the bottom of each panel.
Current usage metrics show cumulative count of Article Views (full-text article views including HTML views, PDF and ePub downloads, according to the available data) and Abstracts Views on Vision4Press platform.
Data correspond to usage on the plateform after 2015. The current usage metrics is available 48-96 hours after online publication and is updated daily on week days.
Initial download of the metrics may take a while.


