Fig. 7
Download original image
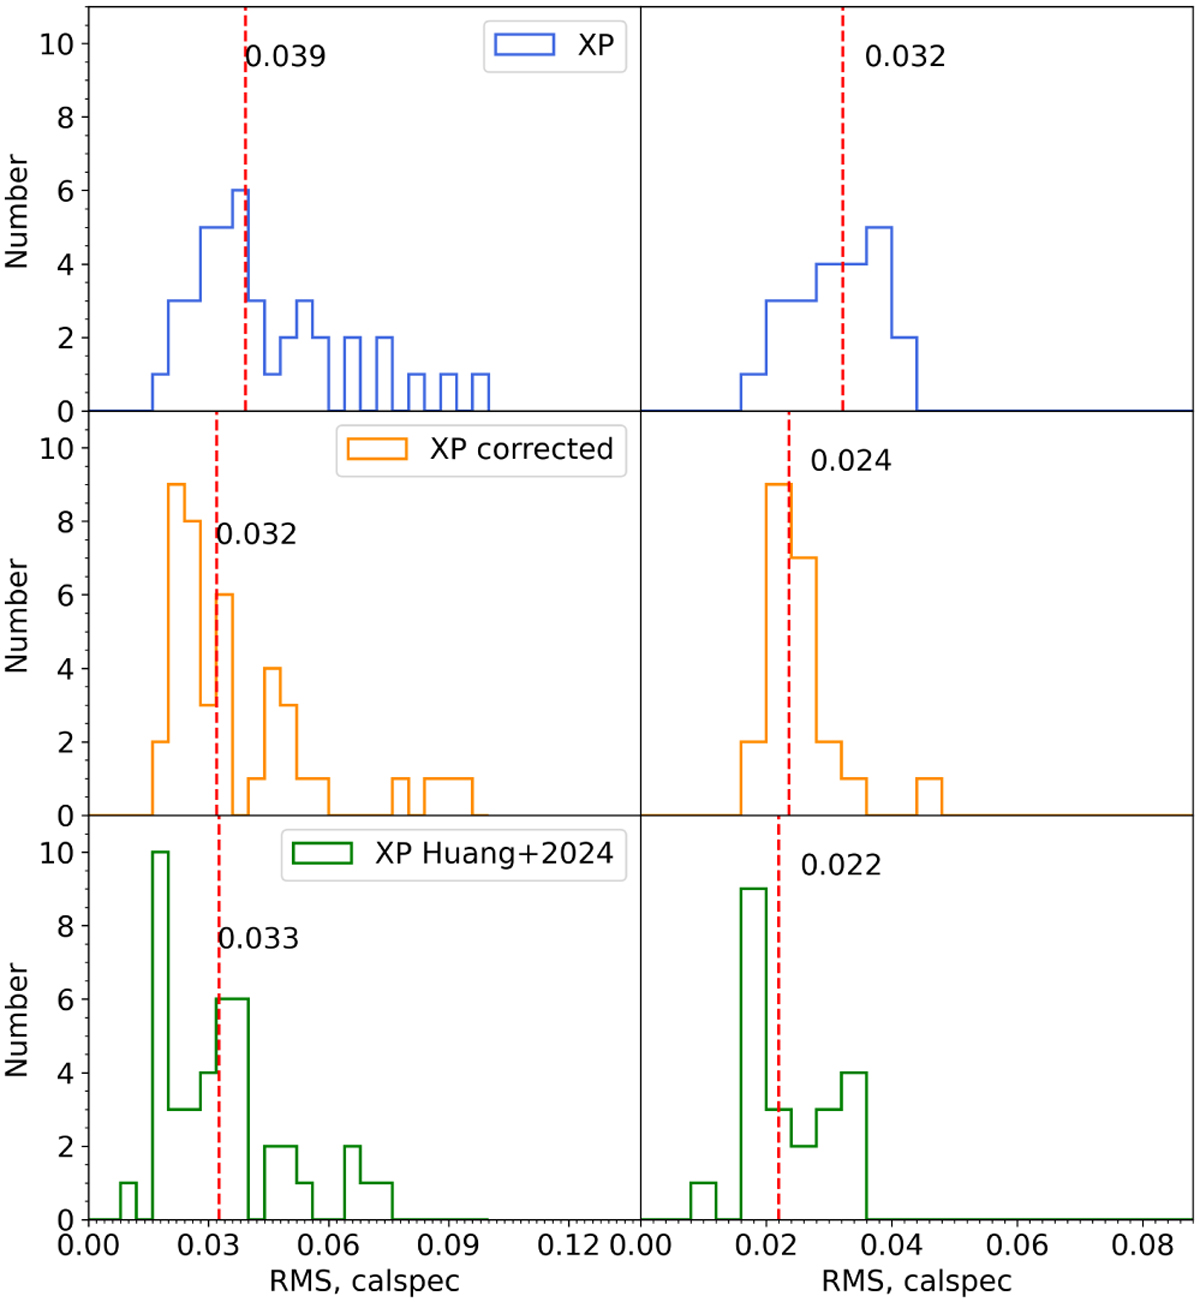
Distribution of RMS between CALSPEC and XP spectra. Left panels: histograms present RMS between the XP spectra and the spectra from CALSPEC libraries before and after correcting patterns, indicating by blue and orange, respectively. The green histogram shows the corresponding results obtained using the Python package from Huang et al. (2024a) to correct the XP spectra. Right panels: similar to those panels in the left, but with stars that have passed the quality cuts applied in Section 5.1. The red dashed lines represent the median values, which are also indicated by the number displayed in each panel.
Current usage metrics show cumulative count of Article Views (full-text article views including HTML views, PDF and ePub downloads, according to the available data) and Abstracts Views on Vision4Press platform.
Data correspond to usage on the plateform after 2015. The current usage metrics is available 48-96 hours after online publication and is updated daily on week days.
Initial download of the metrics may take a while.