Fig. 5
Download original image
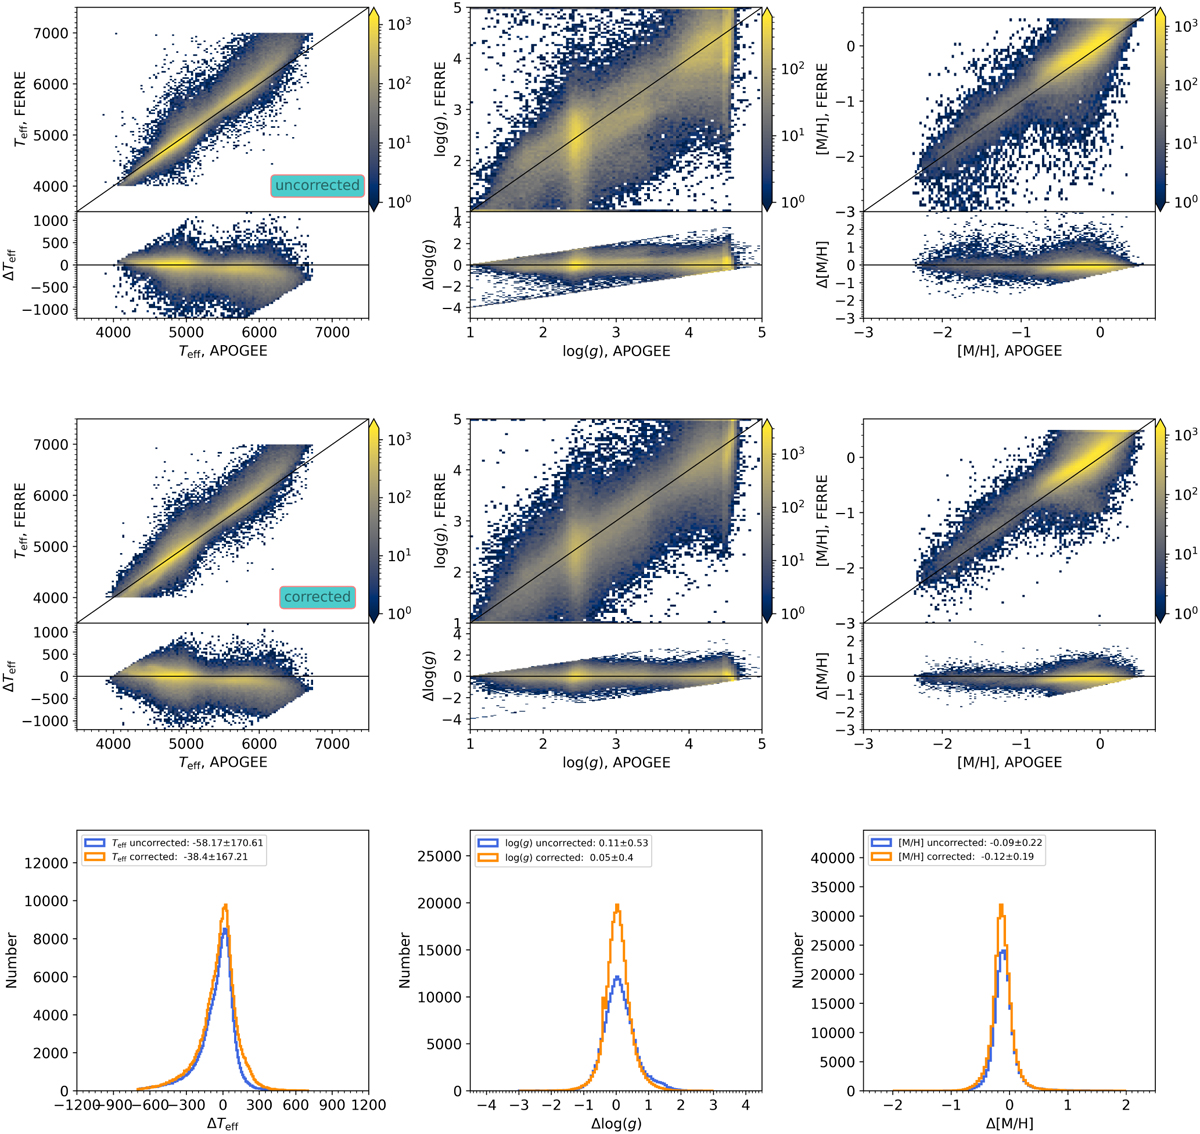
Testing on atmospheric parameters using sampling Sconst. Top panels: comparison of Teff, logg and [M/H] estimated from original XP spectra (Y -axis) and APOGEE survey (X-axis). Middle panels: similar to the top panels, but with Y-axis replaced by the results from corrected XP spectra. The color bar in each subfigure displays the number density. Bottom panels: histograms present the differences of Teff, log ɡ and [M/H] between XP and APOGEE before and after correcting the systematic patterns. The mean values and standard deviations are shown in the labels.
Current usage metrics show cumulative count of Article Views (full-text article views including HTML views, PDF and ePub downloads, according to the available data) and Abstracts Views on Vision4Press platform.
Data correspond to usage on the plateform after 2015. The current usage metrics is available 48-96 hours after online publication and is updated daily on week days.
Initial download of the metrics may take a while.