Fig. 2
Download original image
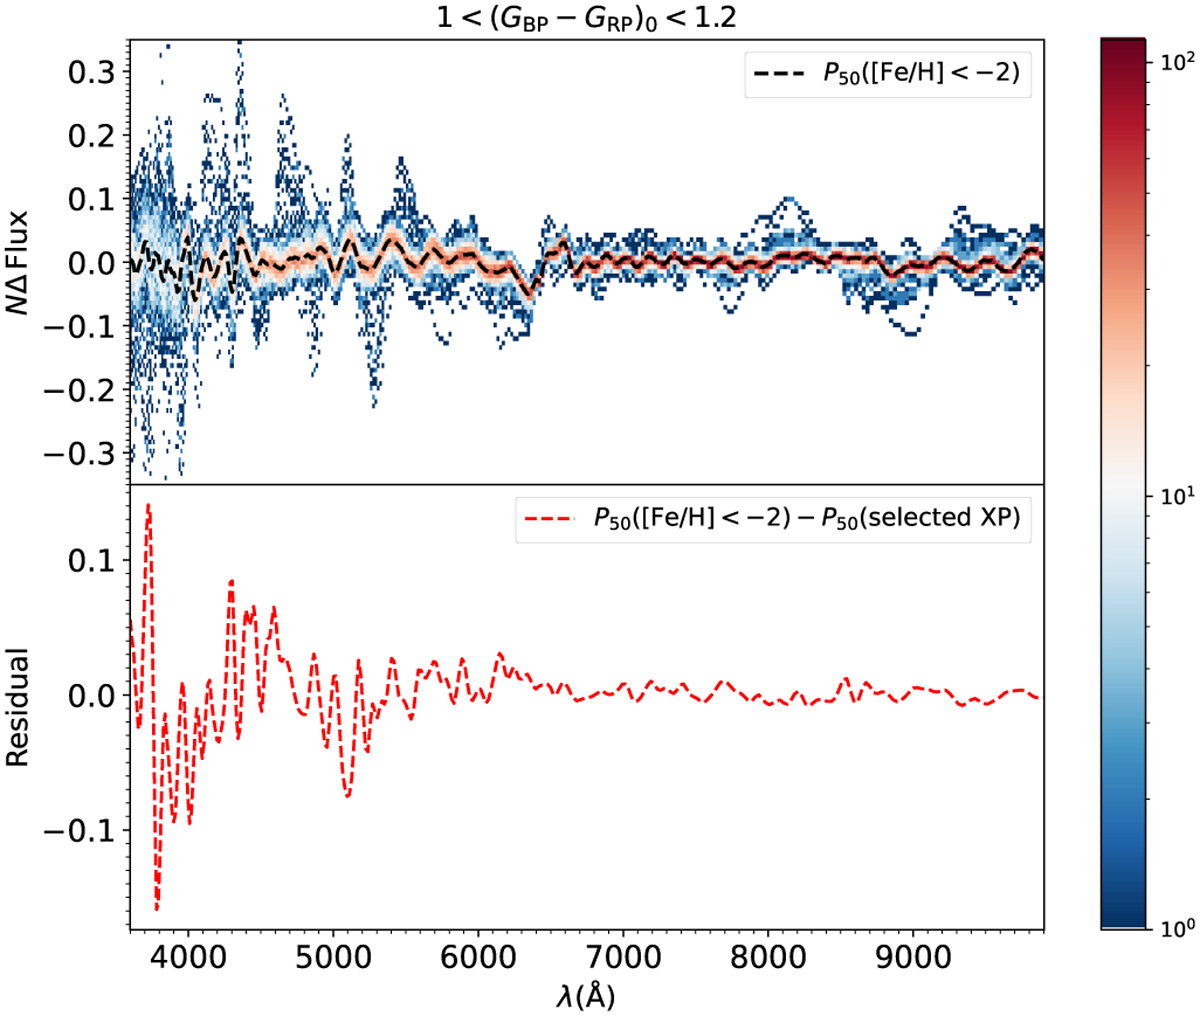
Density distribution of residuals as a function of wavelength for VMP stars. Top panel shows the density distribution of the residuals of VMP stars with 1.0 < GBP − GRP < 1.2 and 13 < G < 15. Compared to the relatively more metal-rich sample in Figure 1, their wiggles have a smaller amplitude with Max (|P50|) < 0.08. The bottom panel shows the difference of P50 between these two samples. The main difference is in the blue band of λ < 6500 Å, while the wiggles in the red band is little affected by the change of metallicity.
Current usage metrics show cumulative count of Article Views (full-text article views including HTML views, PDF and ePub downloads, according to the available data) and Abstracts Views on Vision4Press platform.
Data correspond to usage on the plateform after 2015. The current usage metrics is available 48-96 hours after online publication and is updated daily on week days.
Initial download of the metrics may take a while.