Fig. 1
Download original image
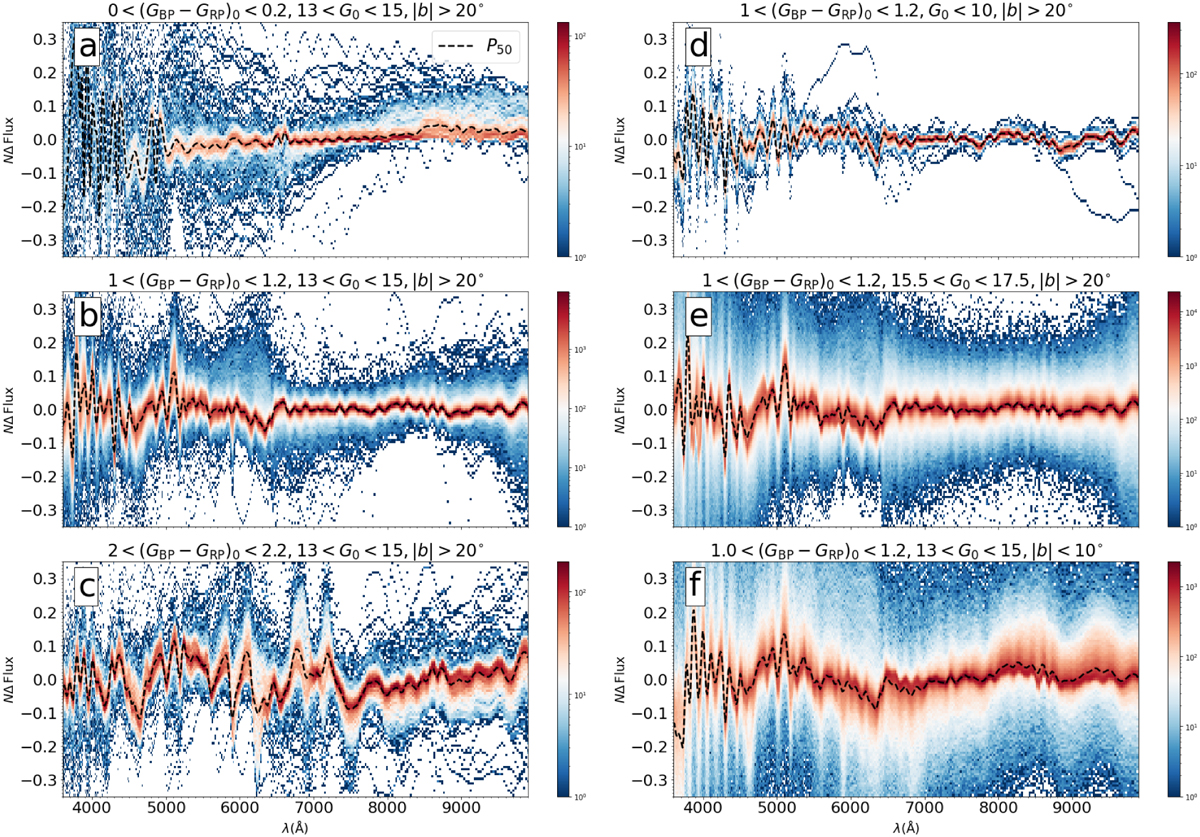
Density distribution of residuals as a function of wavelength for stars with different parameters. Subfigures (a), (b), and (c) are results of stars in bins of the same magnitude range 13 < G0 < 15 but different stellar colors. Subfigures (b), (d), and (e) show the density distribution of residuals for stars within the same range of color 1.0 < (GBP − GRP)0 < 1.2 but different G0. Subfigure (f) shows the residuals of stars of the same color-magnitude as subfigures (b) but in different Galactic latitude (|b| < 10°). The black dash lines represent the P50 percentiles distributions, which can be viewed as a robust representation of the patterns of wiggles. From the P50 lines we can see that the wiggles change with (GBP − GRP)0 and G0 , but the stellar color has a larger impact than the magnitude. Stars of low latitude have a much more diffuse distribution of ∆Flux. The large uncertainties of the extinction map towards the Galactic disc may cause a bad extinction correction of FluxXP for some stars. Therefore, FluxXP is more likely to deviate from the fitting result Fluxfitting for stars at lower latitude.
Current usage metrics show cumulative count of Article Views (full-text article views including HTML views, PDF and ePub downloads, according to the available data) and Abstracts Views on Vision4Press platform.
Data correspond to usage on the plateform after 2015. The current usage metrics is available 48-96 hours after online publication and is updated daily on week days.
Initial download of the metrics may take a while.