Fig. 8.
Download original image
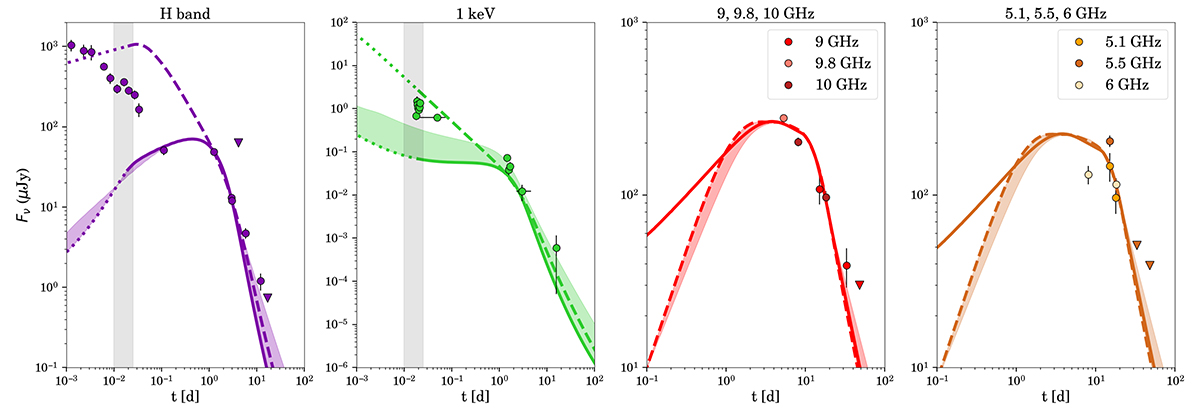
Light curves in the optical, X-ray, and radio bands. The dashed lines show the on-axis top-hat model, while the solid lines represent the off-axis Gaussian model. The shaded coloured regions represent how the model changes with and without the spreading of the jet. In particular, the lower part of these regions represents the model with spreading (coinciding with the solid line), while the top part corresponds to the model without spreading. The vertical shaded regions in the first two panels represent the deceleration time 1σ region. Before that, a likely contribution from the late-time activity of the central engine is at play. Here, afterglowpy modelling is not reliable and data before 0.1 d from the trigger were excluded from the fit.
Current usage metrics show cumulative count of Article Views (full-text article views including HTML views, PDF and ePub downloads, according to the available data) and Abstracts Views on Vision4Press platform.
Data correspond to usage on the plateform after 2015. The current usage metrics is available 48-96 hours after online publication and is updated daily on week days.
Initial download of the metrics may take a while.