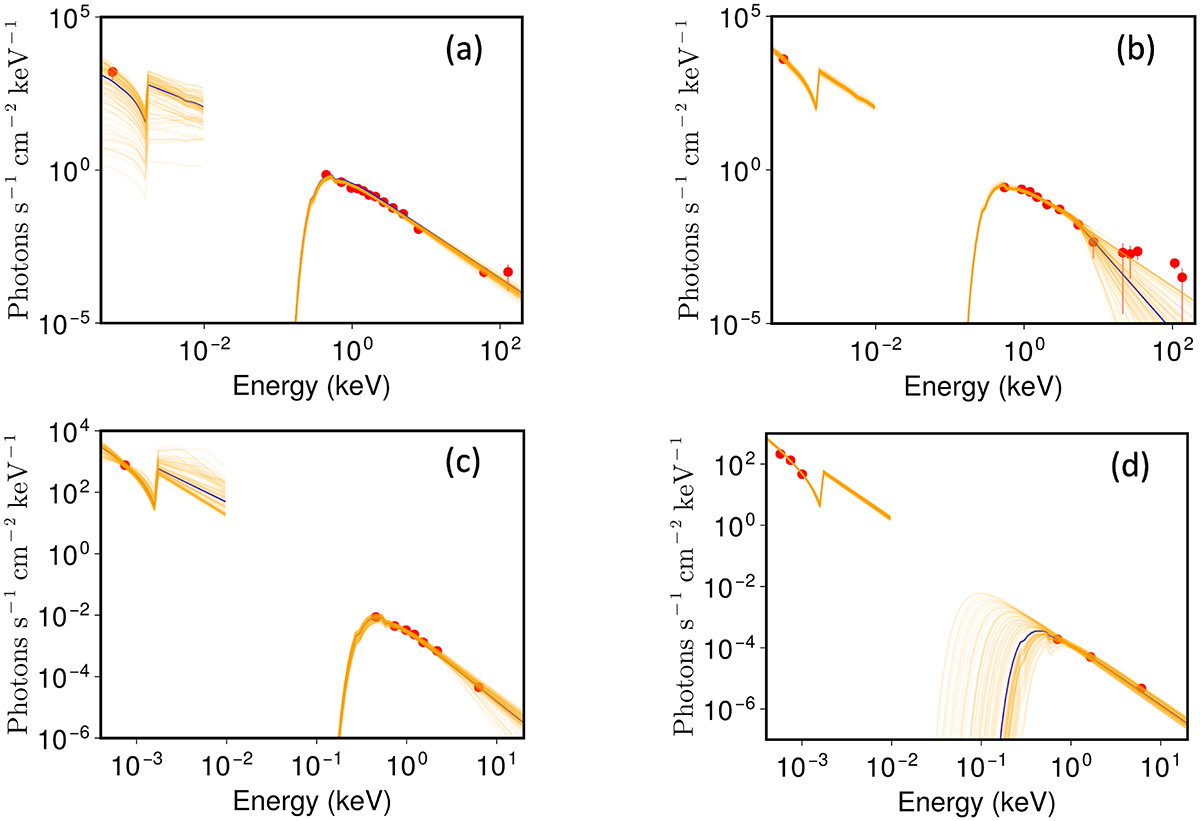
Fig. 7.
Download original image
Spectral energy distribution modelling of GRB 240218A at different times. The top figures refer to BAT, XRT, and REM data in the t − t0 = [160–170] s (left) and [178–188] s (right) intervals (indicated by (a) and (b) in Fig. 6). The bottom left panel shows the SED including XRT and REM points taken ∼103 seconds after the trigger, and the bottom right plot displays the modelling of XRT-LBT data at t − t0 = 1.26 d. The best model for each SED (shown with blue lines in the plots) and the corresponding parameters are reported in Table 4.
Current usage metrics show cumulative count of Article Views (full-text article views including HTML views, PDF and ePub downloads, according to the available data) and Abstracts Views on Vision4Press platform.
Data correspond to usage on the plateform after 2015. The current usage metrics is available 48-96 hours after online publication and is updated daily on week days.
Initial download of the metrics may take a while.