Fig. 6.
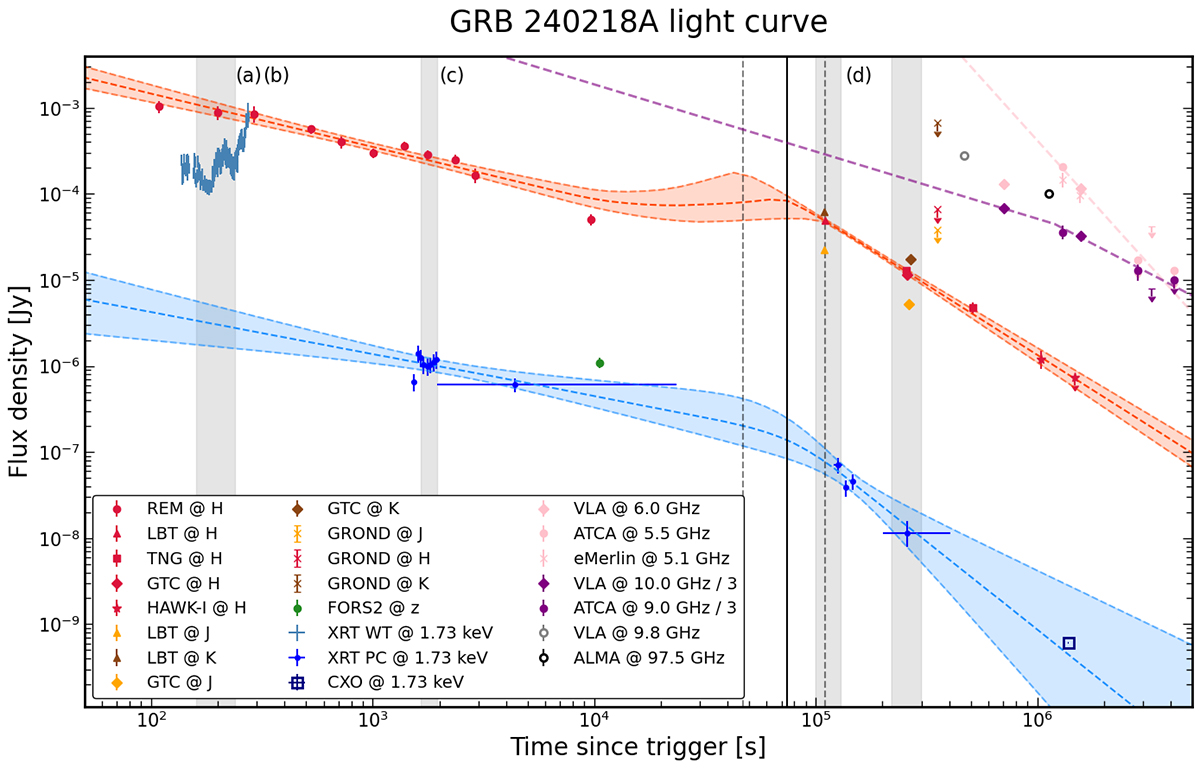
Download original image
X-rays and NIR light curves, along with the best fit and 1σ errors shown with dashed coloured lines. The vertical black lines mark the common break time (solid line) along with its errors (dashed lines). The X-ray light curve is computed at 1.73 keV, the log-mean of the XRT band. The radio light curves are also shown with their power-law best-fit results presented in Sect. 3.3, and empty points report data taken from GCNs. The vertical grey-shaded areas indicate the data used for SED modelling (see Sect. 3.5), and the letters next to them refer to the SEDs shown in Fig. 7. Optical upper limits are not shown for display purposes.
Current usage metrics show cumulative count of Article Views (full-text article views including HTML views, PDF and ePub downloads, according to the available data) and Abstracts Views on Vision4Press platform.
Data correspond to usage on the plateform after 2015. The current usage metrics is available 48-96 hours after online publication and is updated daily on week days.
Initial download of the metrics may take a while.