Open Access
Fig. 3.
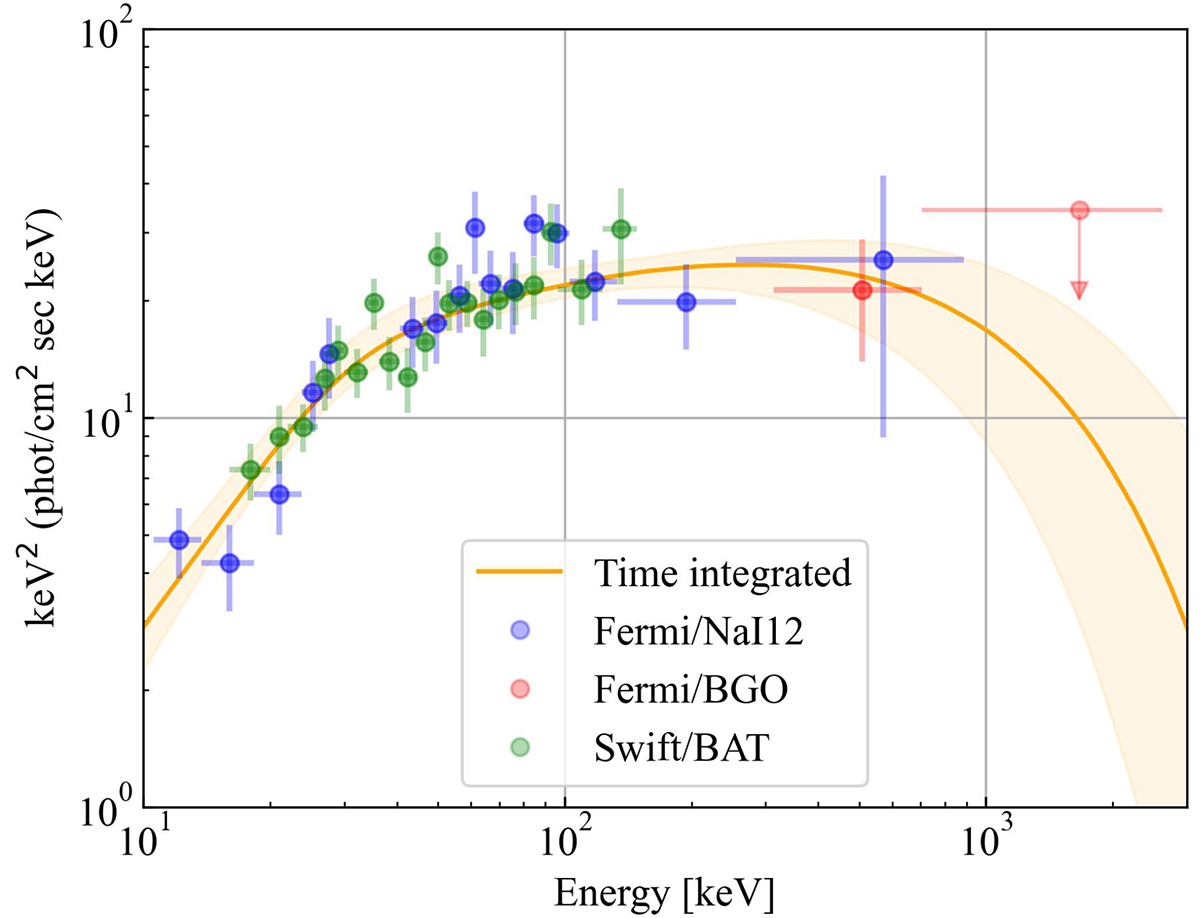
Download original image
Spectral energy distribution of the prompt emission spectrum, averaged over the [ − 2, 30] s time interval. The SBPLCT model is shown by the solid line with the 68% confidence region shown by the shading. The data points are reported with their 1σ errors.
Current usage metrics show cumulative count of Article Views (full-text article views including HTML views, PDF and ePub downloads, according to the available data) and Abstracts Views on Vision4Press platform.
Data correspond to usage on the plateform after 2015. The current usage metrics is available 48-96 hours after online publication and is updated daily on week days.
Initial download of the metrics may take a while.