Fig. 3.
Download original image
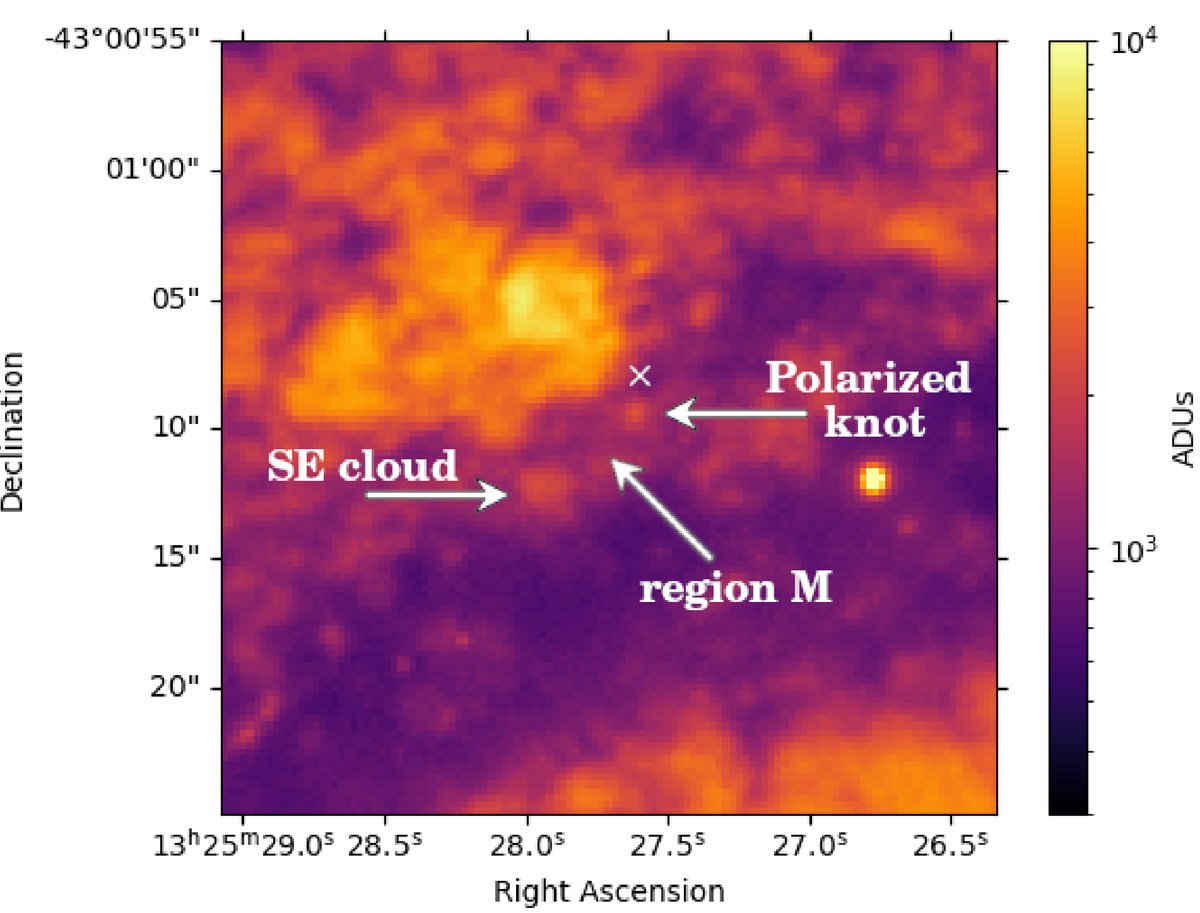
R-band map of the central region of Cen A, in analog to digital units (ADUs). The right arrow points the polarized knot discovered by Schreier et al. (1996) and the left arrow points toward a southeast (SE) cloud that we had the curiosity to examine. The region in-between (labeled as M) is also studied in this paper, as it is likely completely dominated by starlight and can therefore inform us about the impact of dichroic absorption on the polarimetric signal. The white cross marks the supposed location of the supermassive black hole, established from radio measurements (Ojha et al. 2010). The bright dot in the east is a foreground star (Gaia DR3 6088704625623266048). North is up, and east is left.
Current usage metrics show cumulative count of Article Views (full-text article views including HTML views, PDF and ePub downloads, according to the available data) and Abstracts Views on Vision4Press platform.
Data correspond to usage on the plateform after 2015. The current usage metrics is available 48-96 hours after online publication and is updated daily on week days.
Initial download of the metrics may take a while.