Fig. 3
Download original image
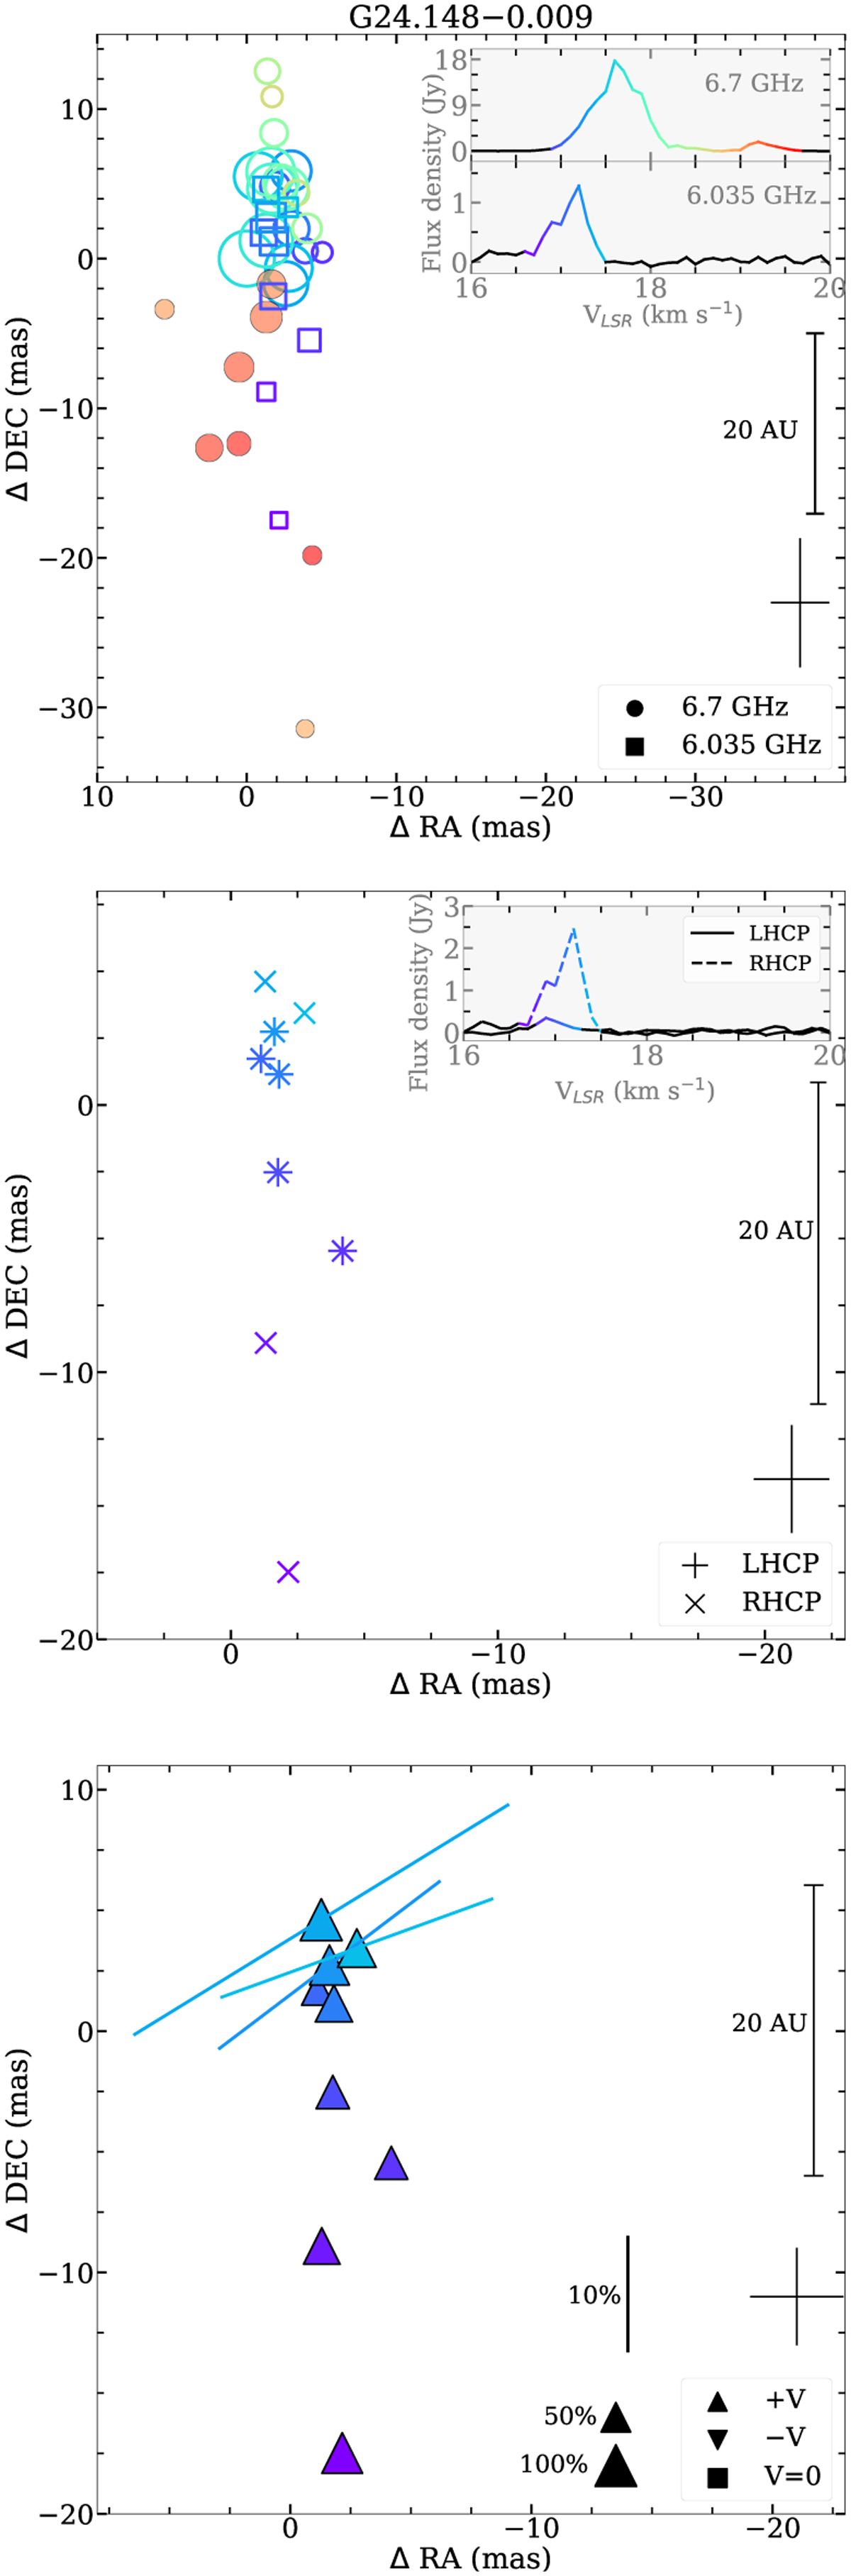
Same as Fig. 2 but for G24.148−0.009. In the bottom panel, the bars represent the direction of the planes containing the electric field vector. Their lengths are proportional to the percentage of linear polarization and their colors correspond to the LSR velocity, as is indicated in the inserted spectra in the top and middle panels.
Current usage metrics show cumulative count of Article Views (full-text article views including HTML views, PDF and ePub downloads, according to the available data) and Abstracts Views on Vision4Press platform.
Data correspond to usage on the plateform after 2015. The current usage metrics is available 48-96 hours after online publication and is updated daily on week days.
Initial download of the metrics may take a while.