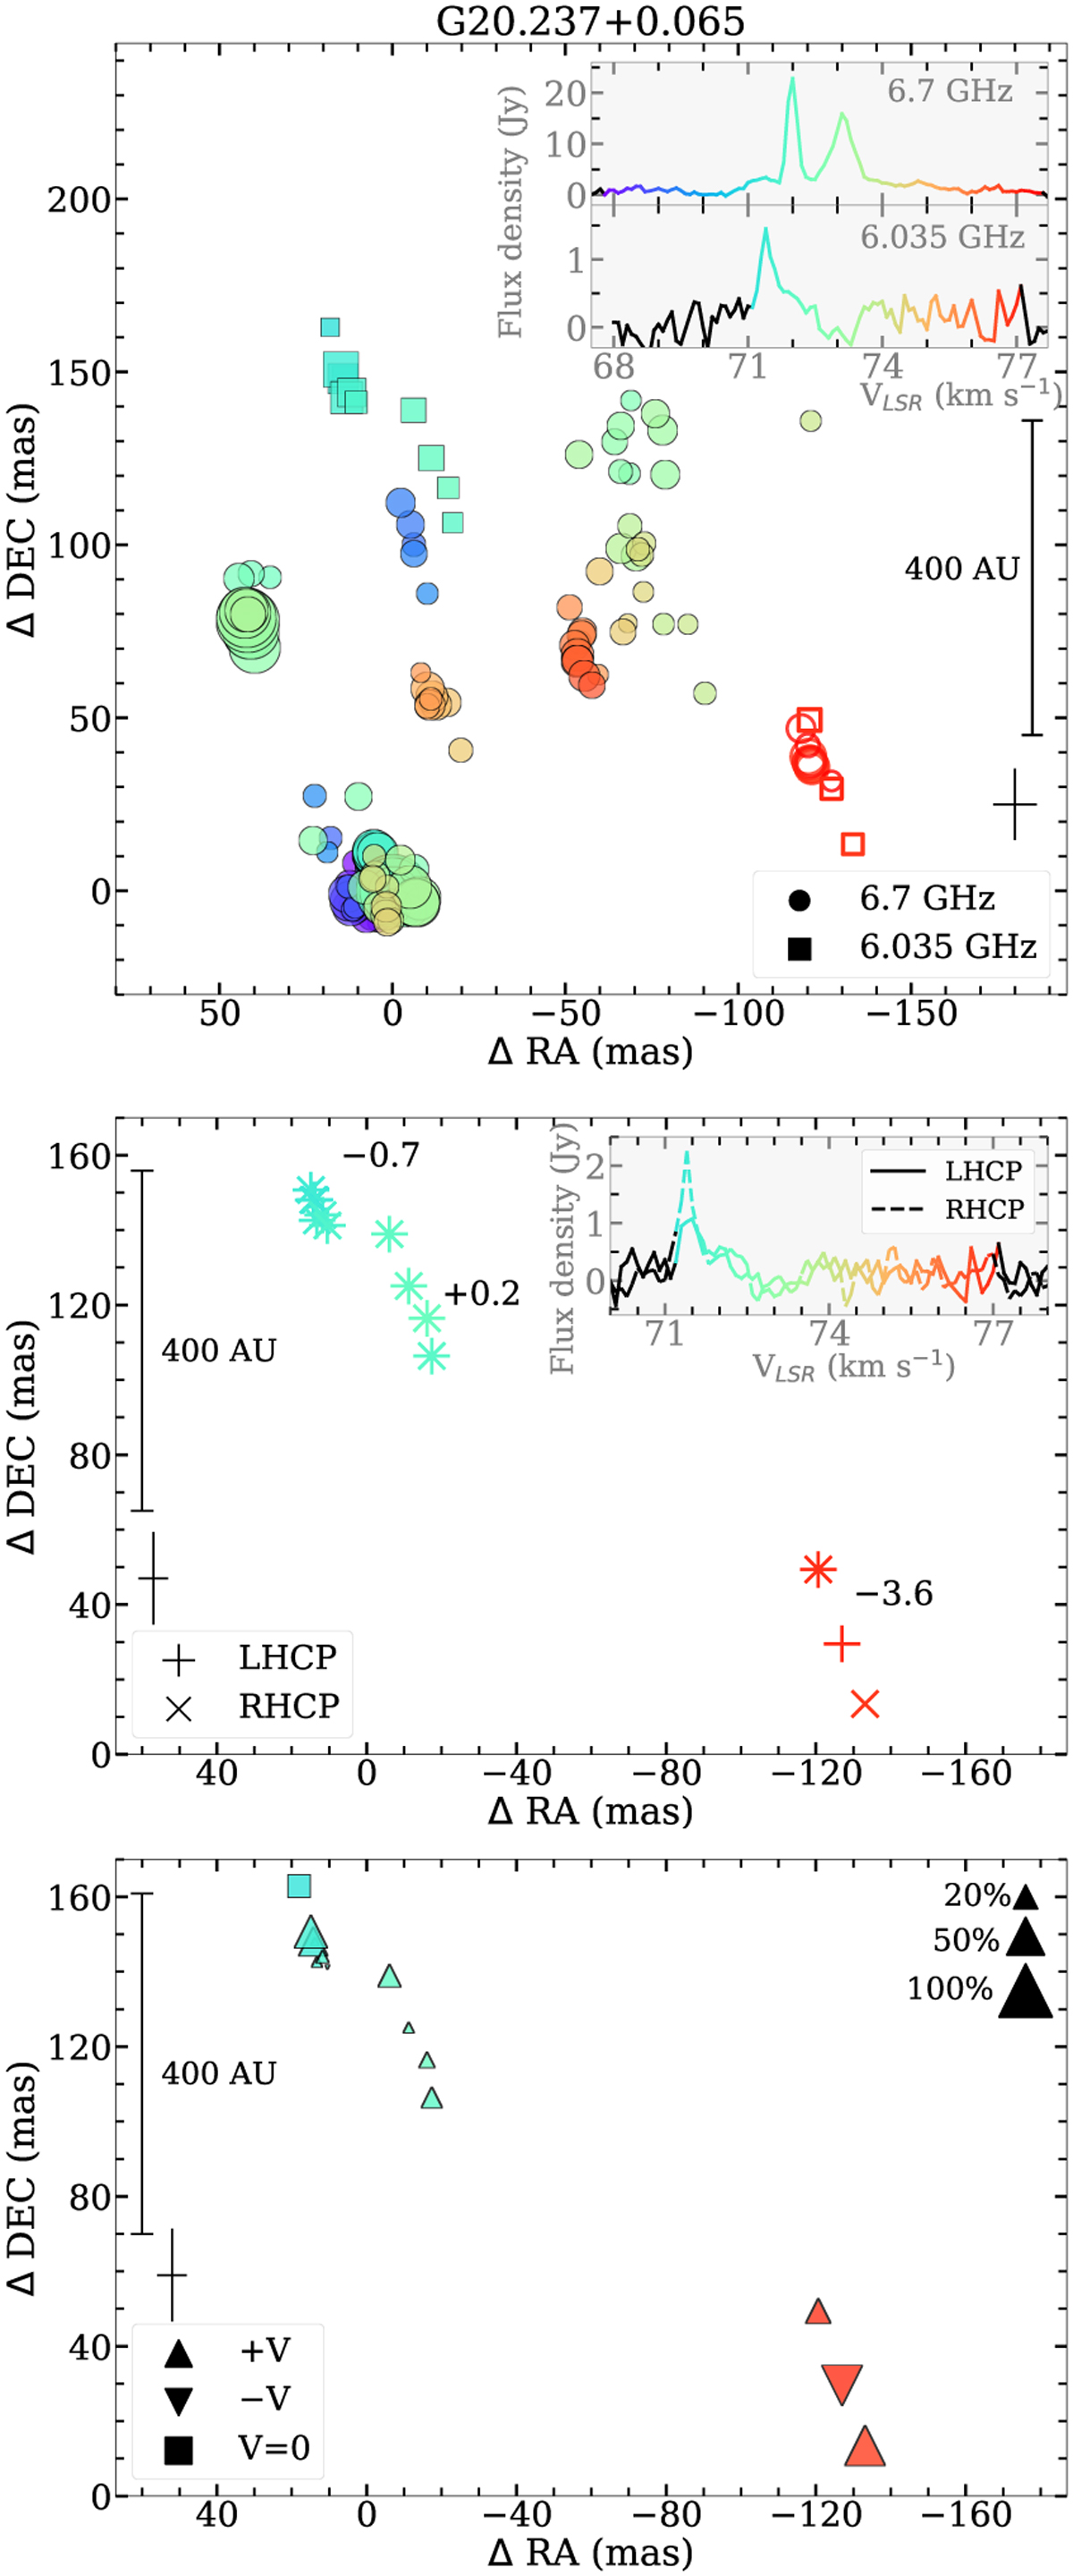
Fig. 2
Download original image
Methanol and ex-OH maser emission in G20.237 + 0.065. Top: distribution of the 6.7 (circles) and 6.035 GHz (squares) Stokes I maser spots. Symbol size is proportional to the square root of intensity, and the color corresponds to the LSR velocity, as is given in the total intensity spectra inserted at the top. LSR velocity ranges with no detections are shown in black. Non-filled symbols correspond to cases in which the coincidence of both transitions occurs. Middle: distributions of LHCP and RHCP of ex-OH maser spots. Numbers are the values of the line-of-sight magnetic field strength (in milligauss). Bottom: distribution of V Stokes of ex-OH. Symbol size is proportional to the degree of circular polarization. The black cross indicates the maximum position error for the spot position.
Current usage metrics show cumulative count of Article Views (full-text article views including HTML views, PDF and ePub downloads, according to the available data) and Abstracts Views on Vision4Press platform.
Data correspond to usage on the plateform after 2015. The current usage metrics is available 48-96 hours after online publication and is updated daily on week days.
Initial download of the metrics may take a while.