Fig. 1
Download original image
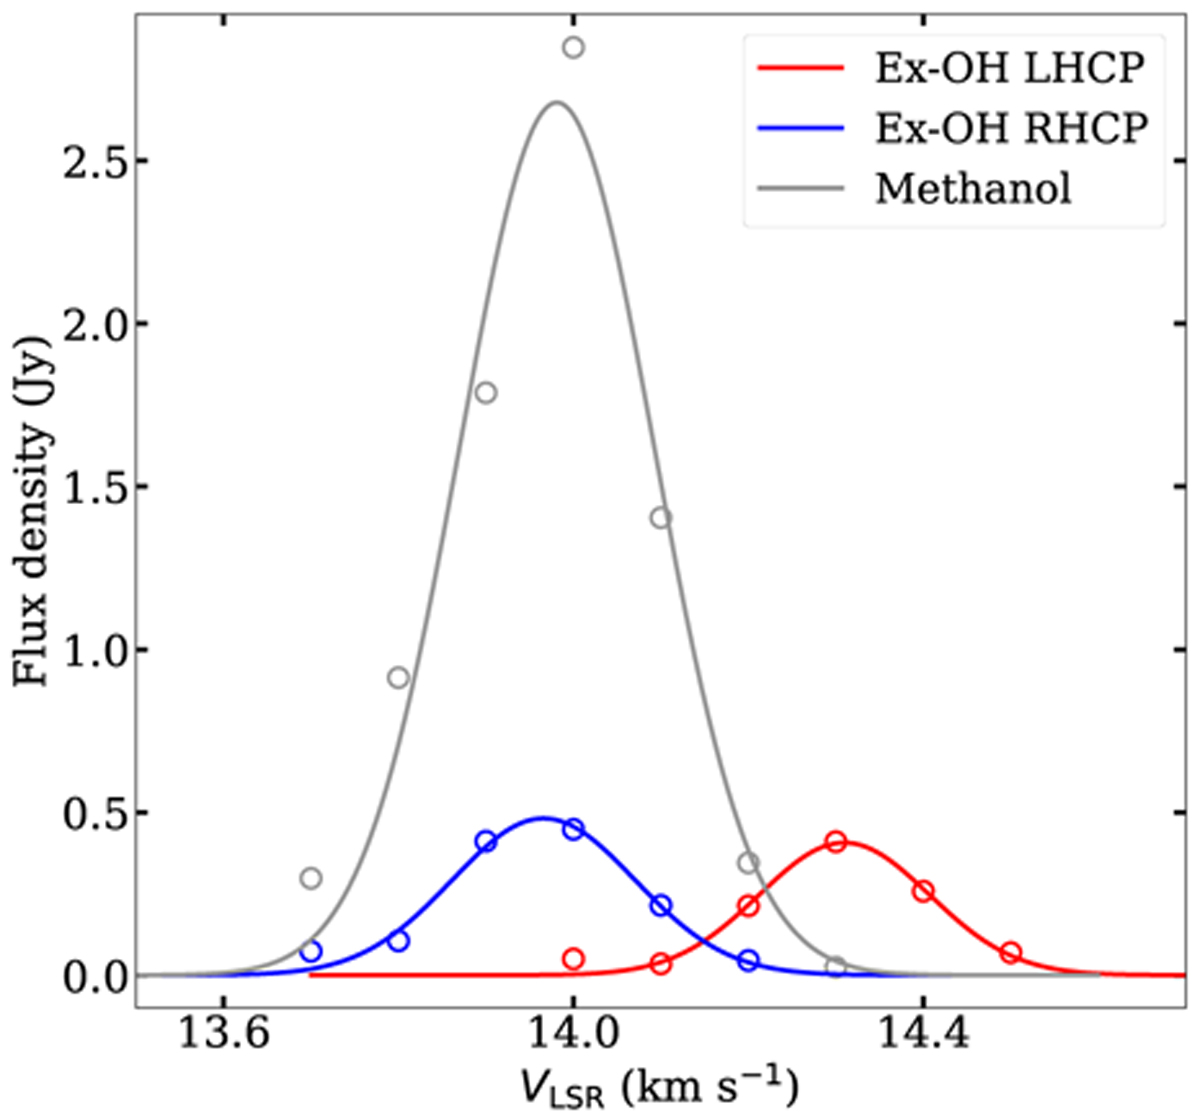
Example of the overlap of both maser transitions when Zeeman splitting is identified in the ex-OH transition. Profiles are from a maser group in G43.149 + 0.013 named as Z8 in ex-OH (Table C.1). The dots correspond to the flux density measured on single-channel maps, and the lines are Gaussian profiles fit to the spectral features.
Current usage metrics show cumulative count of Article Views (full-text article views including HTML views, PDF and ePub downloads, according to the available data) and Abstracts Views on Vision4Press platform.
Data correspond to usage on the plateform after 2015. The current usage metrics is available 48-96 hours after online publication and is updated daily on week days.
Initial download of the metrics may take a while.