Fig. 4.
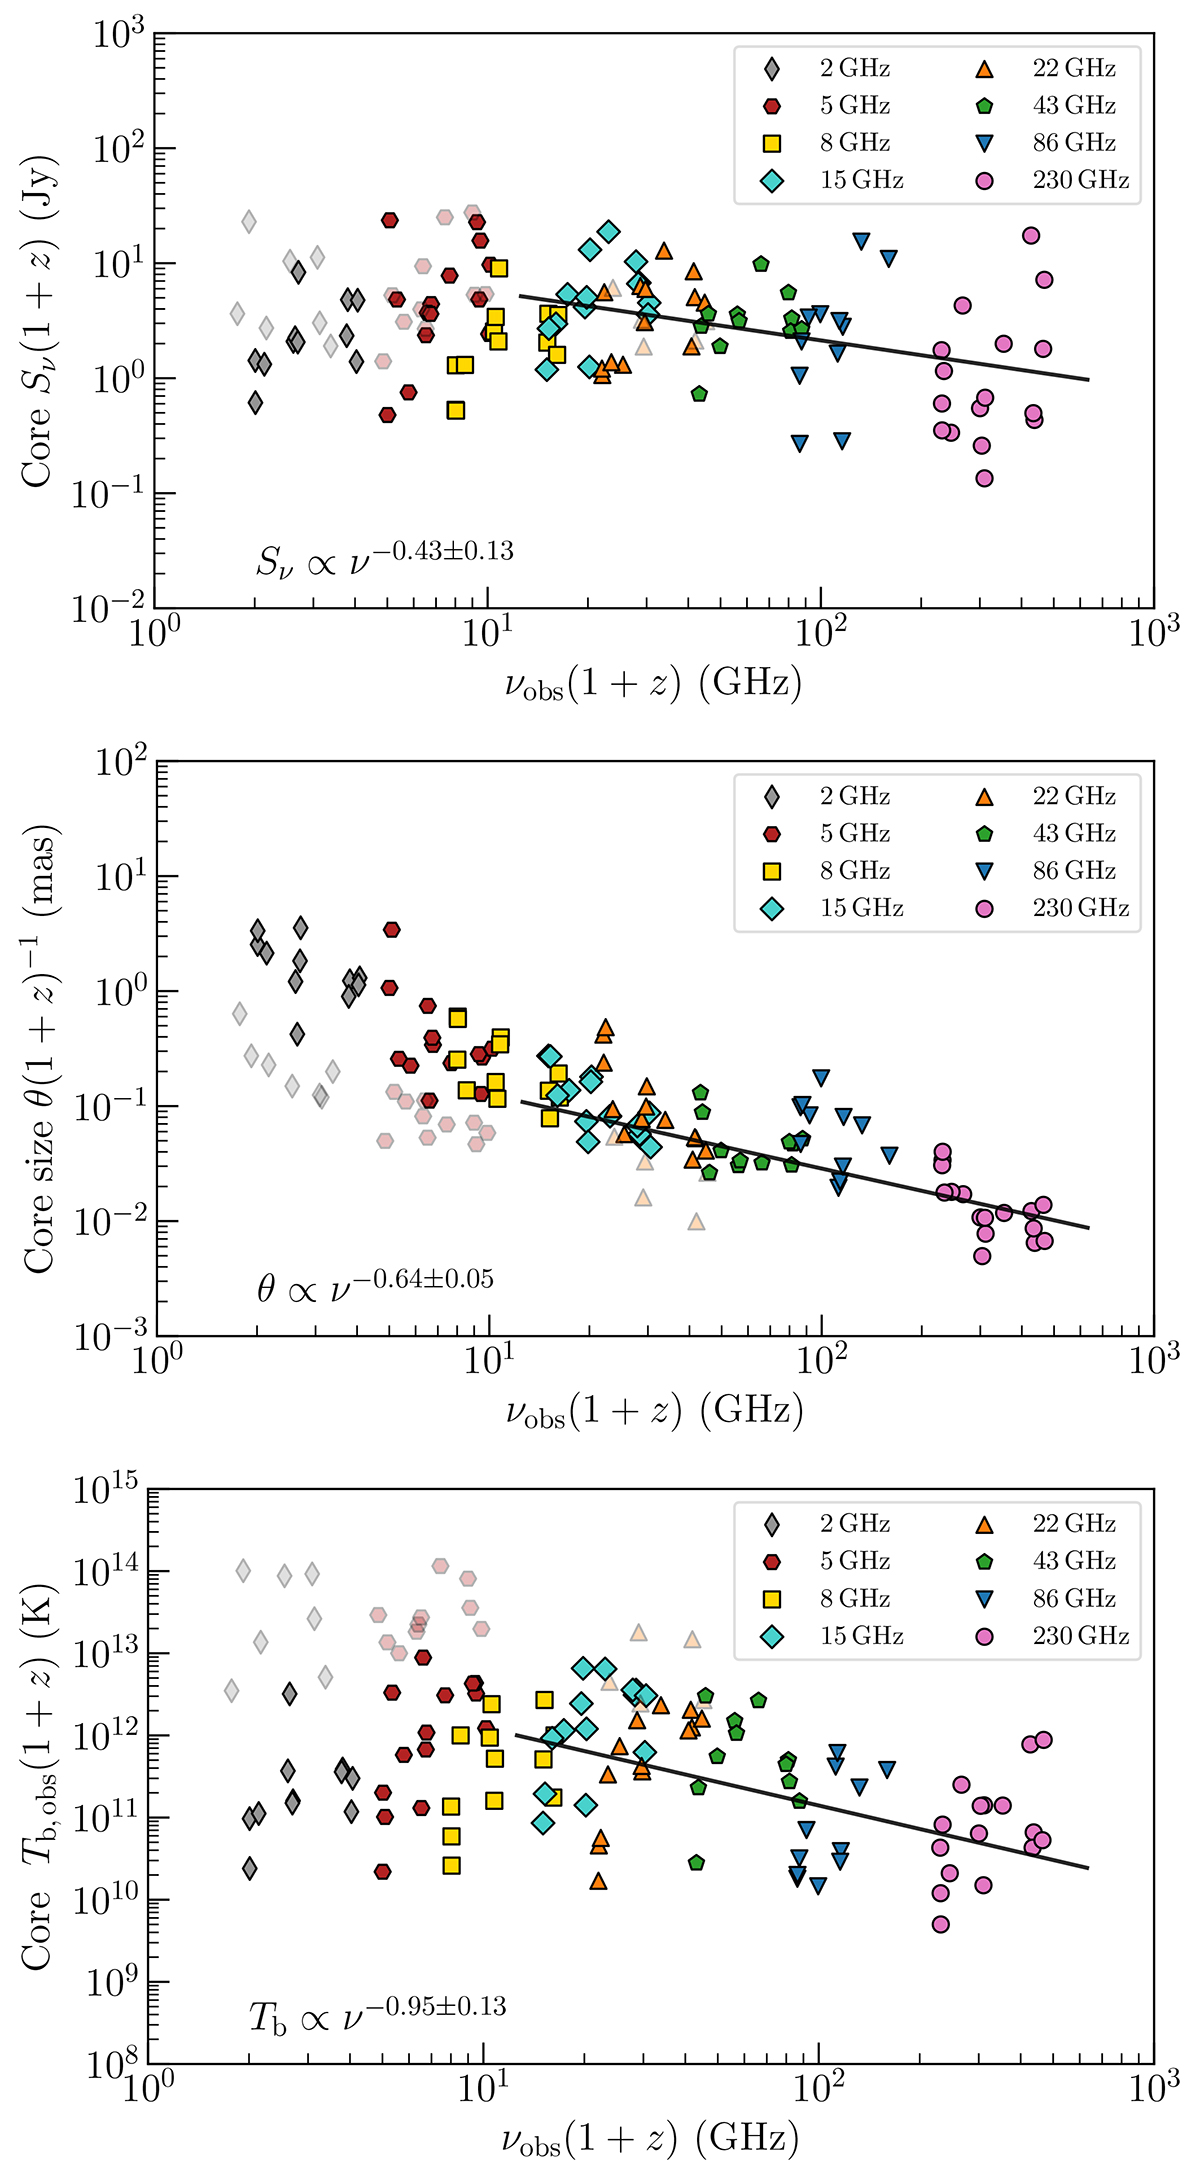
Download original image
Measurements of the core flux density (top), size (middle), and brightness temperature (bottom) obtained using the EHT+ data set of AGN sources, as a function of frequency in the host frame. The 15–230 GHz ground array data in each panel are approximated by power law fits (solid lines, obtained as detailed in Sect. 3.1) and the fit results are annotated. The faded data points are the RadioAstron measurements, while regular data points at the same frequencies correspond to VLBA and VSOP measurements; for comparability, we color the 1.66 GHz (L band) RadioAstron points the same as the 2 GHz (S band) VLBA points. The slope of the core flux density is shallow, Sν ∝ ν−0.4. The core size decreases with frequency (and, in turn, increases with the distance from the central engine) as θ ∝ ν−0.6; the brightness temperature decreases with frequency as Tb ∝ ν−1.0.
Current usage metrics show cumulative count of Article Views (full-text article views including HTML views, PDF and ePub downloads, according to the available data) and Abstracts Views on Vision4Press platform.
Data correspond to usage on the plateform after 2015. The current usage metrics is available 48-96 hours after online publication and is updated daily on week days.
Initial download of the metrics may take a while.