Fig. 2.
Download original image
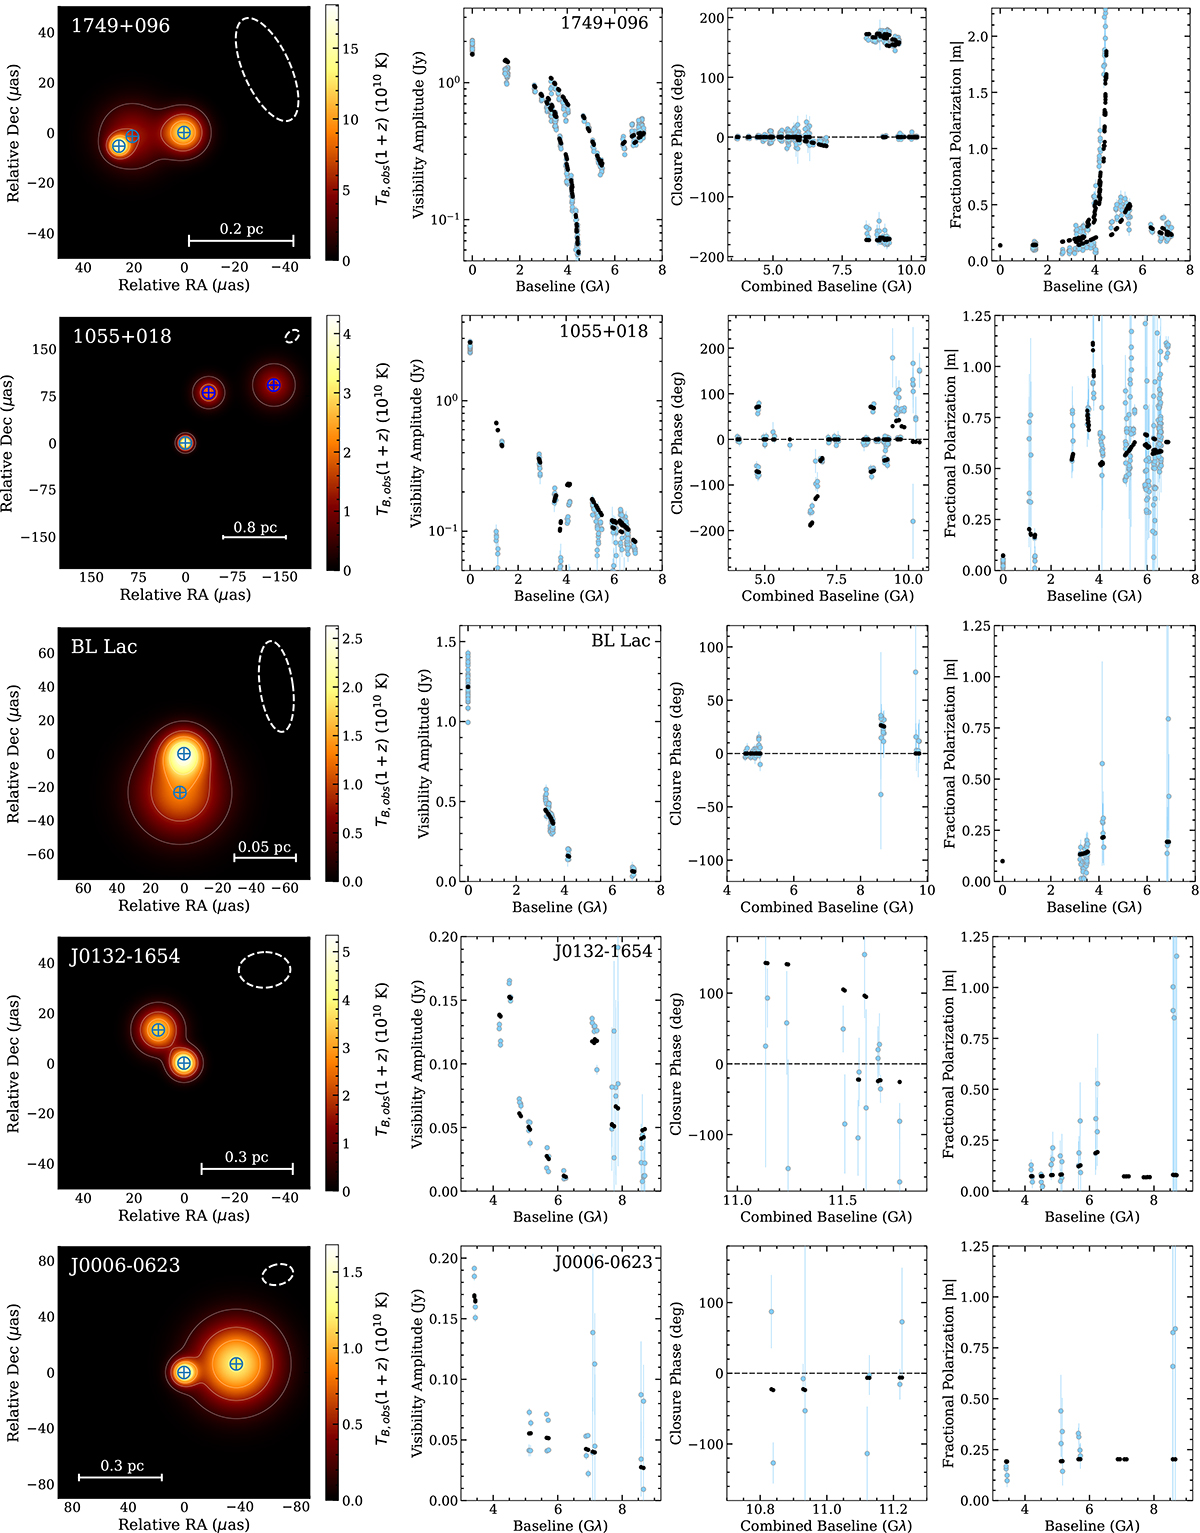
Models of the EHT sources obtained through (polarized) circular Gaussian model fitting with at least two components. Blue crosses in the left column indicate positions of individual components. Contours represent 0.1, 0.3, 0.5, 0.7 and 0.9 of the peak total intensity. EHT observing beams are shown with dashed-line ellipses, to give a sense of the diffraction limited resolution supported by the data sets. We show consistency between models (black) and data (blue) for visibility amplitudes, closure phases, and absolute values of fractional visibility polarization. Closure phases are shown as a function of combined baseline length, which corresponds to a quadrature sum of lengths of all baselines from a given triangle. The visibility domain fractional polarization may exceed unity for resolved sources, such as is the case for 1749+096. The data shown contain detections only and no upper limits.
Current usage metrics show cumulative count of Article Views (full-text article views including HTML views, PDF and ePub downloads, according to the available data) and Abstracts Views on Vision4Press platform.
Data correspond to usage on the plateform after 2015. The current usage metrics is available 48-96 hours after online publication and is updated daily on week days.
Initial download of the metrics may take a while.