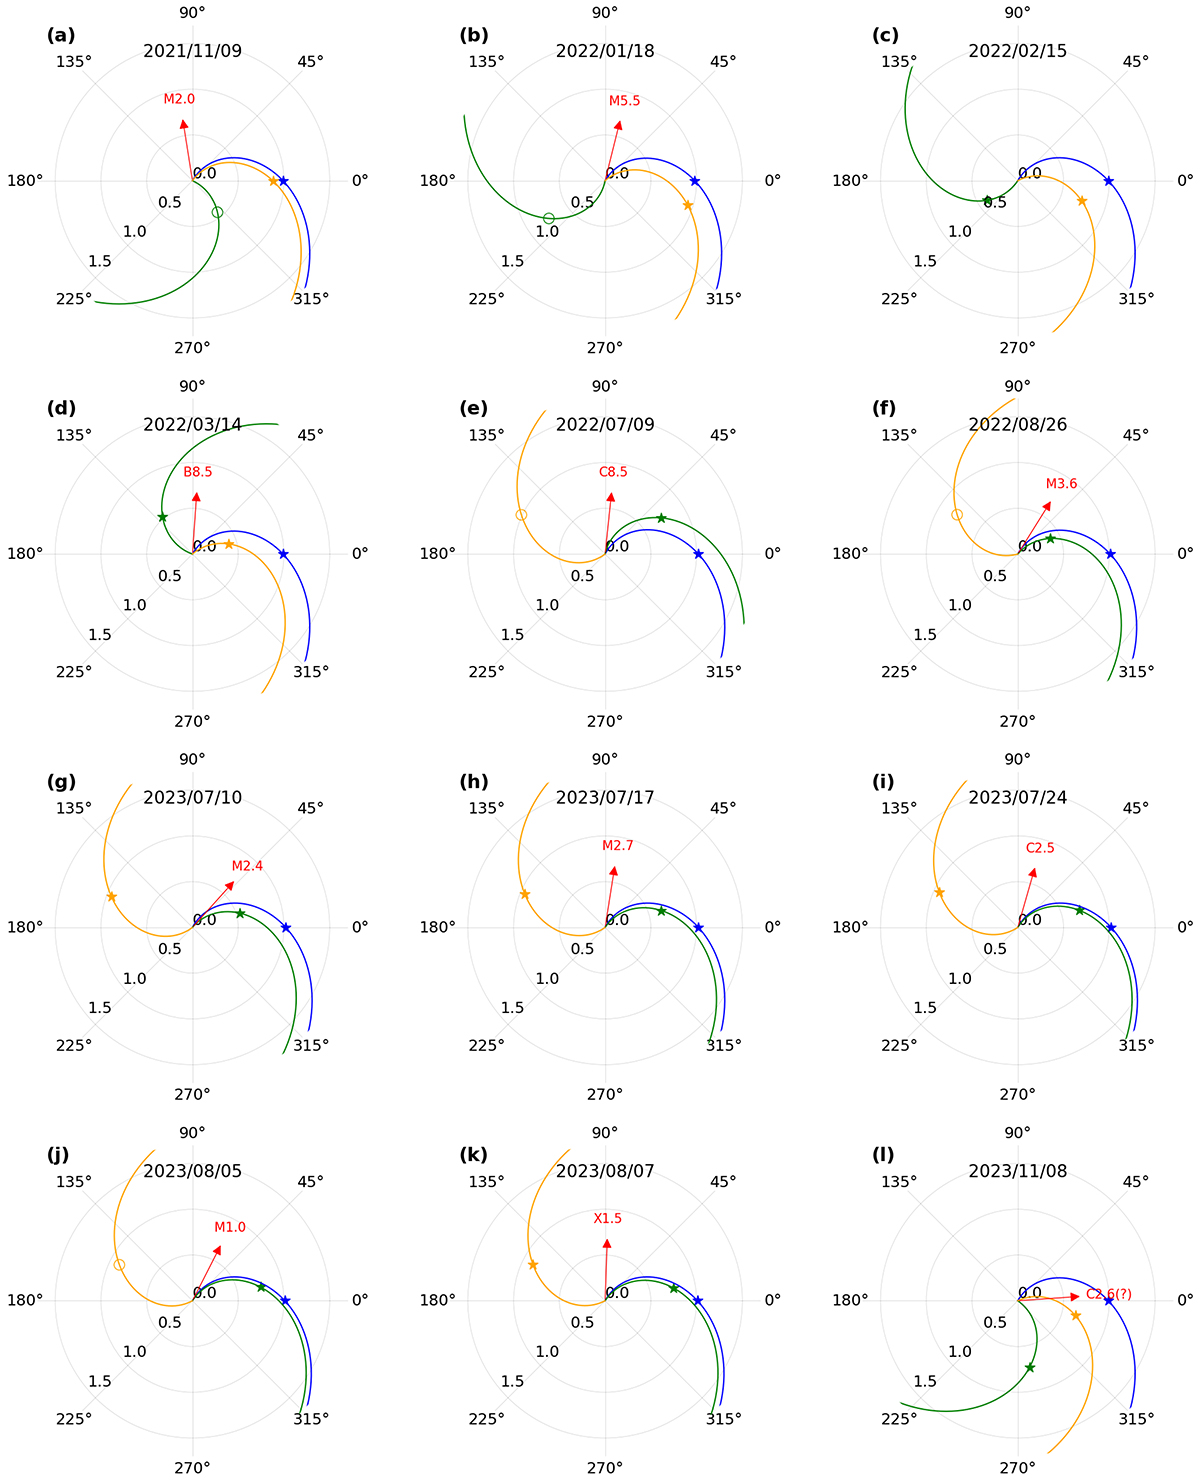
Fig. A.1.
Download original image
Illustration of various satellites spatial distribution (in the equatorial plane of the Stonyhurst coordinate system, with the Earth always corresponding to 0° longitude) during the onset of each SEP event in Group B (except for one event shown in Fig. 2). Observers marked by stars have seen the arrival of energetic protons, while those marked by an empty circle did not observe the SEPs. Different colors symbolize the nominal Parker spirals for SOHO (blue), PSP (green) and Solar Orbiter (orange). In each panel, the red arrow indicates the longitude of the flare. The flare direction is not certain in panel (l) and the flare is not observed from Earth in panel (c).
Current usage metrics show cumulative count of Article Views (full-text article views including HTML views, PDF and ePub downloads, according to the available data) and Abstracts Views on Vision4Press platform.
Data correspond to usage on the plateform after 2015. The current usage metrics is available 48-96 hours after online publication and is updated daily on week days.
Initial download of the metrics may take a while.