Fig. 6.
Download original image
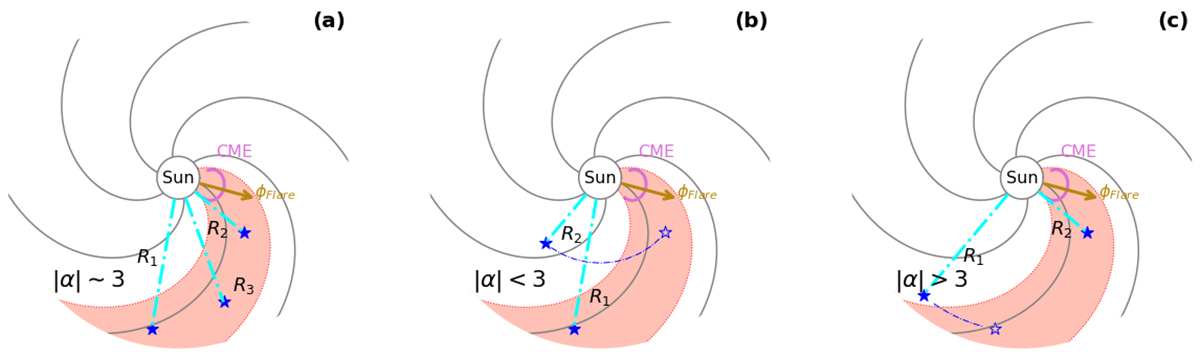
Schematic illustrating how magnetic connectivity may affect the peak flux and α. Panels (a)–(c) depict three different connectivity scenarios. The red region represents the area in which SEP events can effectively reach the observer because the magnetic connectivity is good. The possible main acceleration sources of SEPs are CME shocks and flares, which are marked by the pink arc and gold arrow, respectively. The solid blue stars present the location of the observers, and the empty stars are the projected point of the observer from outside the red region to inside the region at the same radial distance. The expected radial dependence of the peak flux is |α|∼3, < 3, and > 3 for the three different panels.
Current usage metrics show cumulative count of Article Views (full-text article views including HTML views, PDF and ePub downloads, according to the available data) and Abstracts Views on Vision4Press platform.
Data correspond to usage on the plateform after 2015. The current usage metrics is available 48-96 hours after online publication and is updated daily on week days.
Initial download of the metrics may take a while.