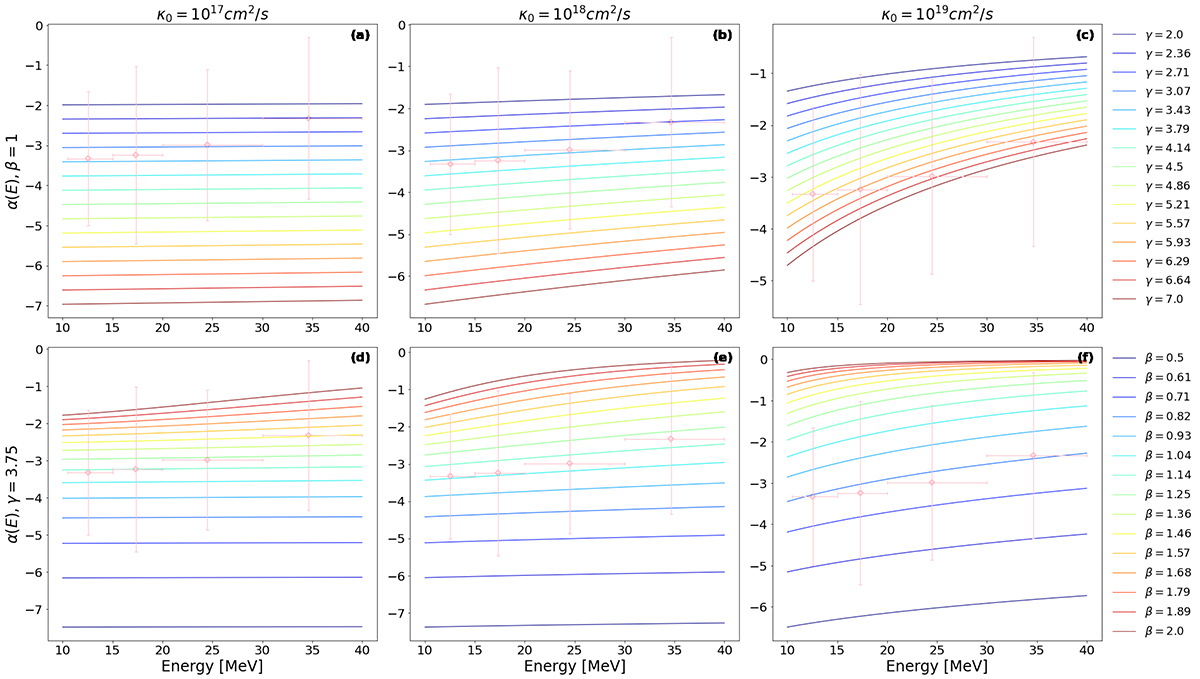
Fig. 5.
Download original image
Relation between α(E) (y-axis) for the peak flux and particle energy E(x-axis) with the evolution of the theoretical spectral and propagation parameters, γ, κ0, and β. Panels (a)–(c) explore the variations when β equals 1, while panels (d)–(f) present the results for γ at 3.75. In each panel, the pink diamonds represent the α within four energy ranges, derived from the mean value of Group B, and the error bars are the derived standard deviation.
Current usage metrics show cumulative count of Article Views (full-text article views including HTML views, PDF and ePub downloads, according to the available data) and Abstracts Views on Vision4Press platform.
Data correspond to usage on the plateform after 2015. The current usage metrics is available 48-96 hours after online publication and is updated daily on week days.
Initial download of the metrics may take a while.