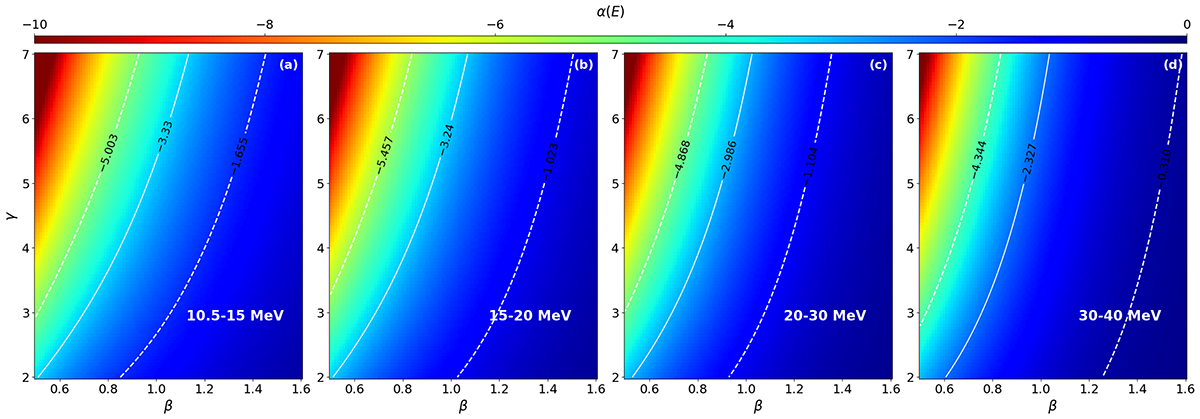
Fig. 4.
Download original image
Relation between α(E) (see the color bar at the top) for the peak flux and two parameters, γ (y-axis) and β (x-axis), in four different energy ranges shown in panels (a)–(d). The solid white line represents the mean value derived for Group B events, and the dashed white lines indicate the mean value plus and minus the standard deviation. The scaling factor of the diffusion parameter κ0 was fixed in this case to 1019 cm2/s. An animated version of this figure including results from different κ0 ranging from 1017 to 1020 cm2/s is available online.
Current usage metrics show cumulative count of Article Views (full-text article views including HTML views, PDF and ePub downloads, according to the available data) and Abstracts Views on Vision4Press platform.
Data correspond to usage on the plateform after 2015. The current usage metrics is available 48-96 hours after online publication and is updated daily on week days.
Initial download of the metrics may take a while.