Fig. 3.

Download original image
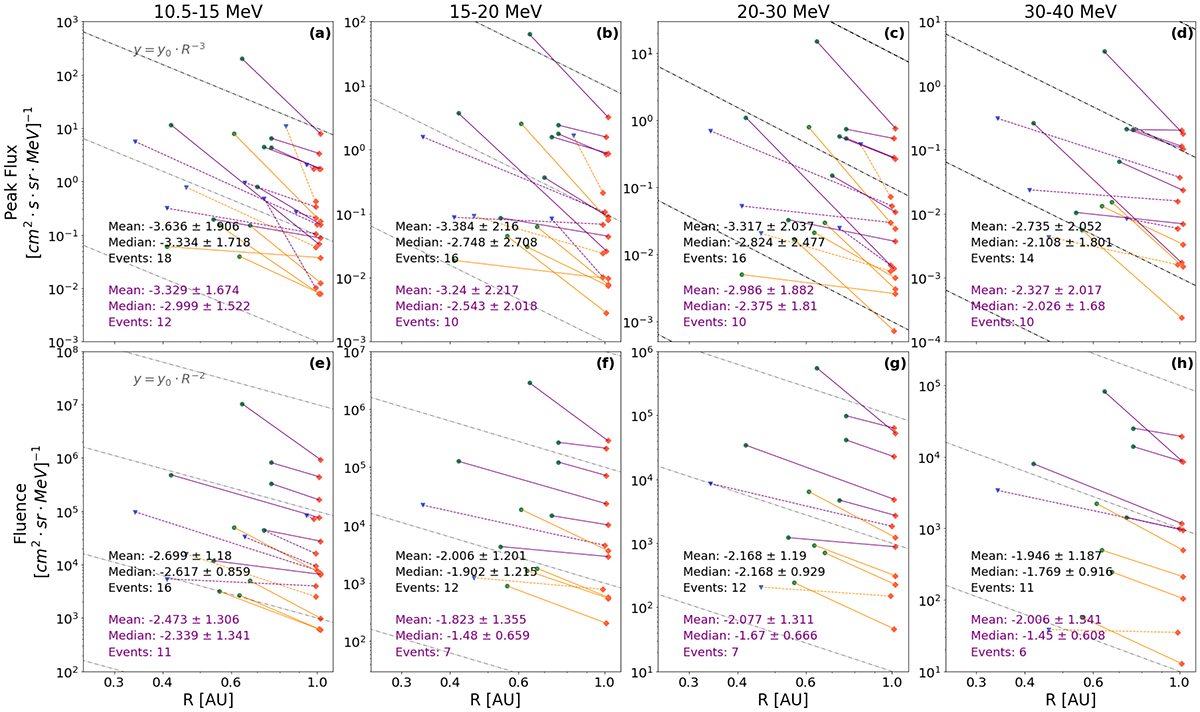
Radial dependence of the peak flux and fluence of the selected SEP events measured by SOHO and PSP (or Solar Orbiter). Each line connects the same SEP event during which the longitudinal separation of the nominal Parker spirals of the two observers is < 30°. The upper four panels (a, b, c, and d) illustrate the radial dependence of the peak flux in four different energy ranges, respectively. The lower four panels depict the radial dependence of the fluence in four energy ranges, respectively. The red diamonds represent the proton intensity measured by SOHO, and the blue triangles and green circles represent the measurements by the Solar Orbiter and PSP satellites, respectively. Extreme results (α < −10 or α > 0) were excluded (92% events remain for each panel on average). All lines (purple and orange) represent the events in Group A (a total of 22 events) with the mean or median of the α values shown as the black legend. The purple lines highlight the impulsive SEP events observed by both observers, i.e., Group B (a total of 13 events), with the mean and median of the α values shown as the purple legend. More details can be found in the text.
Current usage metrics show cumulative count of Article Views (full-text article views including HTML views, PDF and ePub downloads, according to the available data) and Abstracts Views on Vision4Press platform.
Data correspond to usage on the plateform after 2015. The current usage metrics is available 48-96 hours after online publication and is updated daily on week days.
Initial download of the metrics may take a while.


