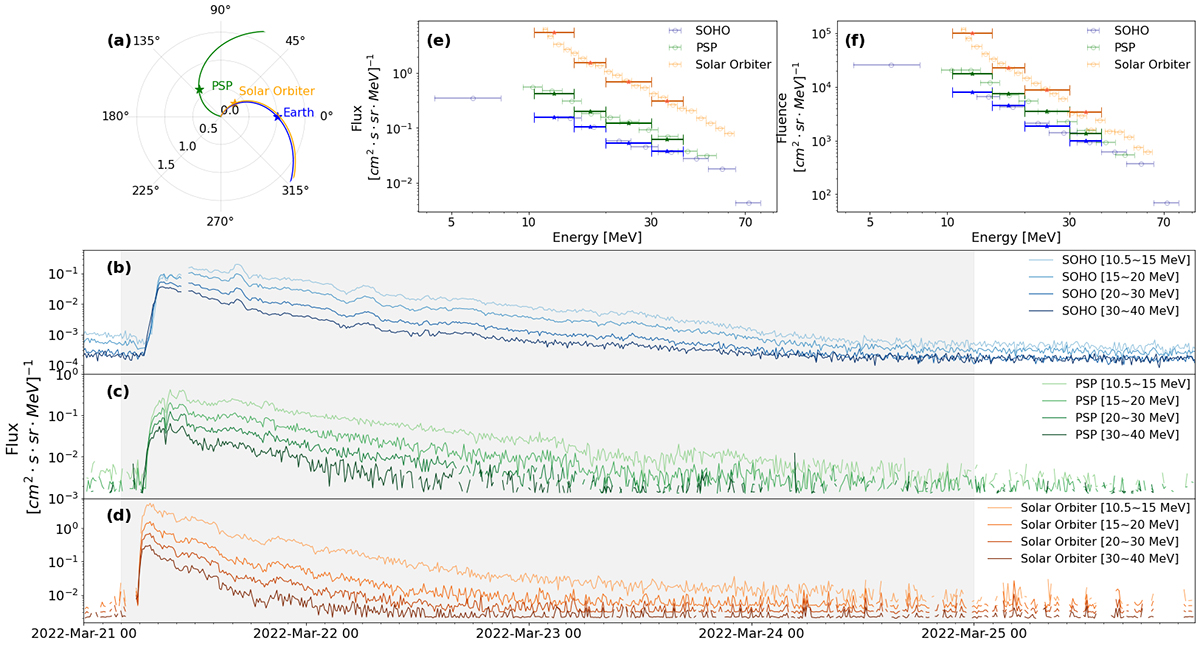
Fig. 2.
Download original image
Example of the event analysis. Panel (a) depicts the spatial distribution of the satellites in the heliospheric equatorial plane on March 21, 2022. Panels (b)–(d) illustrate the temporal evolution of the proton flux for three satellites in various energy ranges. Panels (e) and (f) present the spectra derived from the peak time of each energy and event-integrated period (shadow area in panels (b)–(d)), respectively. The light lines correspond to the original data sourced from mission websites, and the dark lines represent data that we interpolated to the four energy ranges defined in this analysis.
Current usage metrics show cumulative count of Article Views (full-text article views including HTML views, PDF and ePub downloads, according to the available data) and Abstracts Views on Vision4Press platform.
Data correspond to usage on the plateform after 2015. The current usage metrics is available 48-96 hours after online publication and is updated daily on week days.
Initial download of the metrics may take a while.