Fig. 6
Download original image
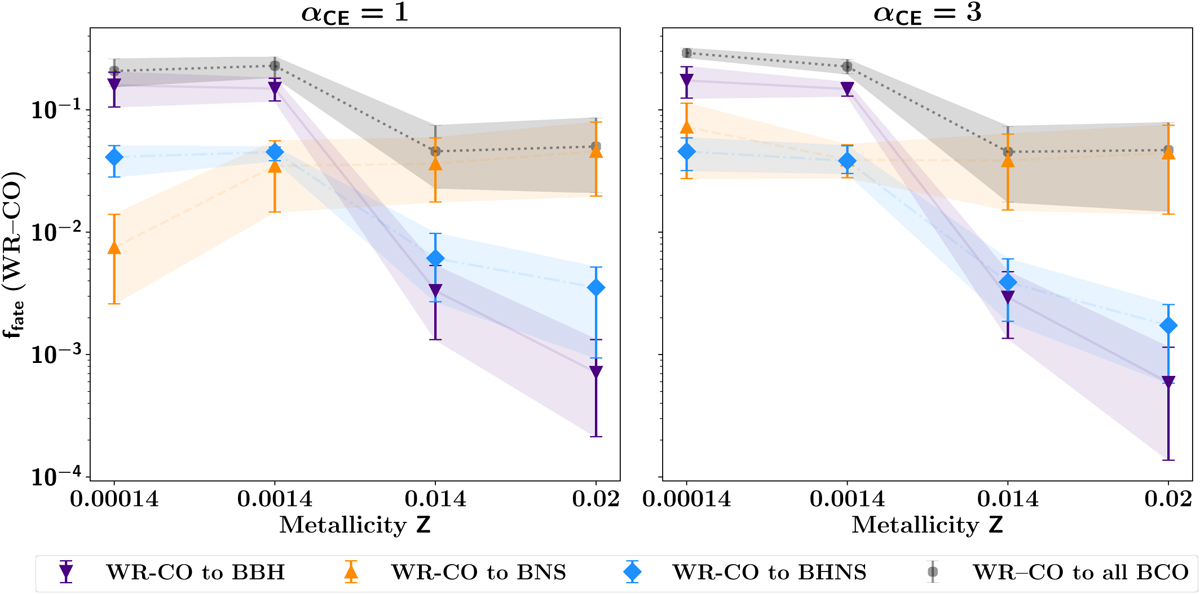
Median fraction ffate of WR–COs that were able to produce BCOs as a function of metallicity. The left-hand (right-hand) plot refers to αCE = 1 (αCE = 3). In each set, we consider all WR–CO systems and we count how many of them form any type of BCOs (gray lines, circle markers), only BBHs (purple lines, lower triangle markers), only BHNSs (blue lines, diamond markers), and only BNSs (yellow lines, upper triangle markers). For each (Z, αCE) pair and BCO type, we consider the distribution of the 12 ffate fractions of the corresponding simulated sets (combinations of CCSN and natal kick models, see Table 1), and show their median values (scatter points) and 68% credible intervals (error bars).
Current usage metrics show cumulative count of Article Views (full-text article views including HTML views, PDF and ePub downloads, according to the available data) and Abstracts Views on Vision4Press platform.
Data correspond to usage on the plateform after 2015. The current usage metrics is available 48-96 hours after online publication and is updated daily on week days.
Initial download of the metrics may take a while.