Fig. 8.
Download original image
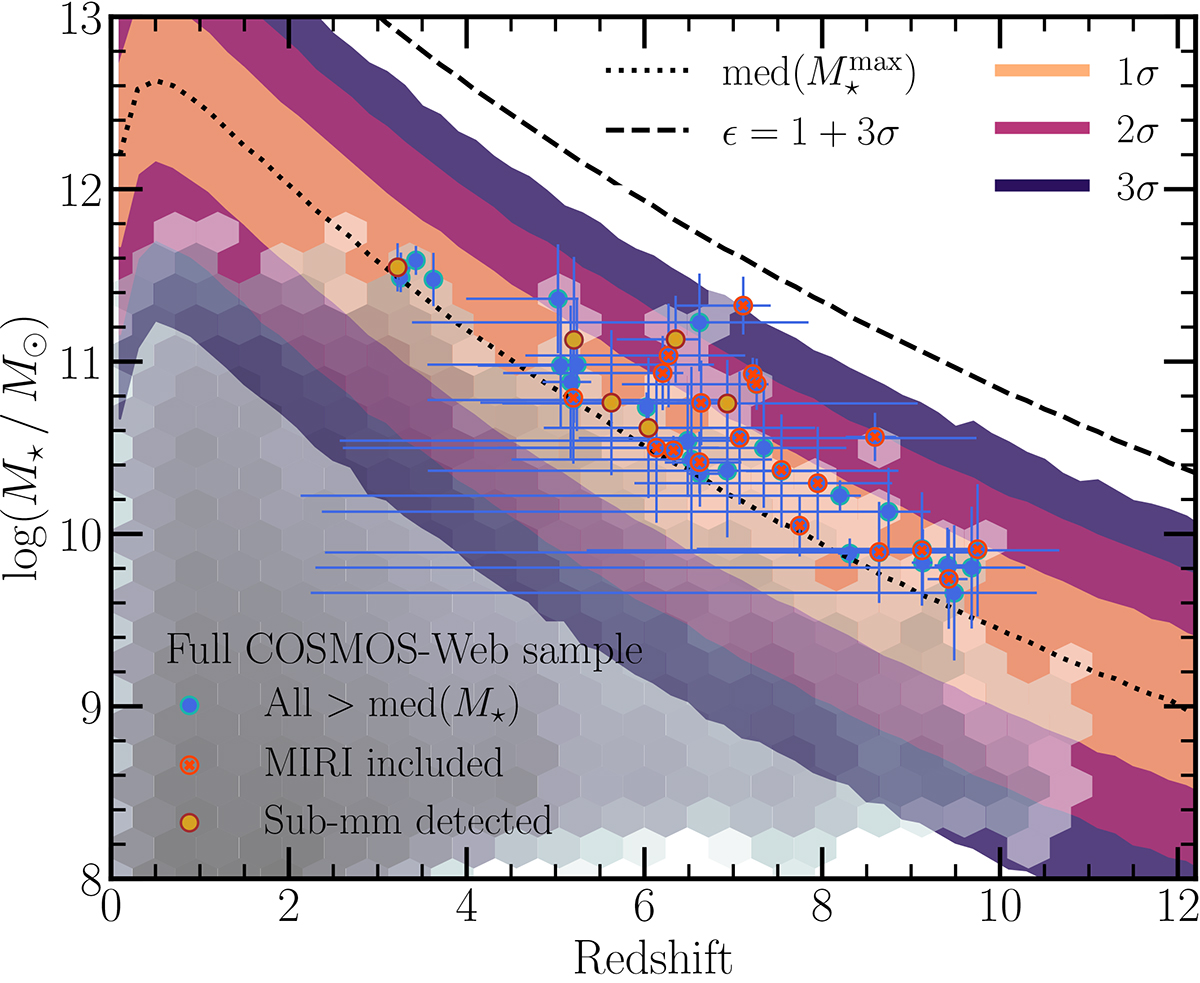
Theoretical limits imposed from halo abundances of the most massive plausible galaxies at a given epoch and volume within the extreme value statistics (EVS) formalism. The colored regions indicate the EVS confidence intervals for the COSMOS-Web survey area of 0.43 deg2. The dotted line marks the median of the EVS distribution of the maximum plausible stellar mass, assuming a log-normal distribution of the SFE centered at ∼0.14, while the dashed line shows the 3σ upper limit assuming a SFE of unity. The grayscale hex bin histogram shows the M⋆ − zphot distribution of the full sample. Above the median ![]() , the points mark individual galaxies in blue; those that have MIRI photometry are colored orange, and submillimeter detected sources are marked with yellow. The observed M⋆ are corrected for the Eddington bias using Eq. (10). We find several candidates that are within the 2 and 3σ upper limits from the EVS as exceptionally massive for their epoch and volume. We mark submillimeter detected galaxies that are highly dust-attenuated with discrepant zphot and M⋆ solutions when including FIR-to-radio data in the SED fitting.
, the points mark individual galaxies in blue; those that have MIRI photometry are colored orange, and submillimeter detected sources are marked with yellow. The observed M⋆ are corrected for the Eddington bias using Eq. (10). We find several candidates that are within the 2 and 3σ upper limits from the EVS as exceptionally massive for their epoch and volume. We mark submillimeter detected galaxies that are highly dust-attenuated with discrepant zphot and M⋆ solutions when including FIR-to-radio data in the SED fitting.
Current usage metrics show cumulative count of Article Views (full-text article views including HTML views, PDF and ePub downloads, according to the available data) and Abstracts Views on Vision4Press platform.
Data correspond to usage on the plateform after 2015. The current usage metrics is available 48-96 hours after online publication and is updated daily on week days.
Initial download of the metrics may take a while.