Fig. 7.
Download original image
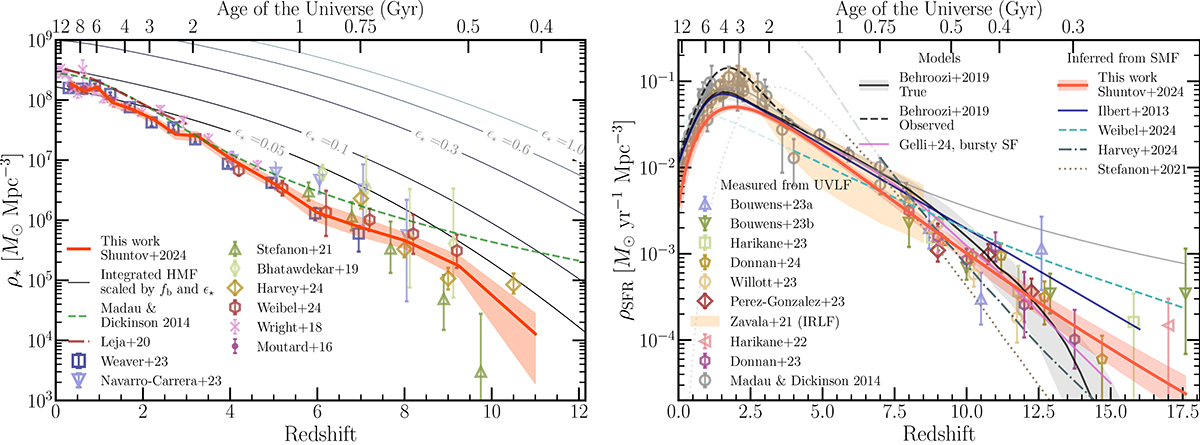
Cosmic evolution of the stellar mass and star formation rate density. Left: Evolution of the SMD, showing a steady increase with time, with no significant change in slope at 1 < z < 9. Results from our work are shown in the orange line (median) and envelope (1σ uncertainty) in both panels. This is computed by integrating best-fit SMF at a given redshift from a common lower limit of 108 M⊙. The comparison with some of the most recent literature results includes Moutard et al. (2016), Wright et al. (2018), Bhatawdekar et al. (2019), Leja et al. (2020), Stefanon et al. (2021), Weaver et al. (2023), Navarro-Carrera et al. (2023), Weibel et al. (2024) and Harvey et al. (2025). The dashed green line shows the ρ⋆ obtained by integrating the Madau & Dickinson (2014) SFRD function multiplied by a time-dependent return fraction based on Chabrier IMF (see Sect. 5.6). The gray lines show the theoretical limits imposed by the HMF, scaled by the baryonic fraction fb and different integrated SFEs ϵ⋆, integrated from the same 108 M⊙ limit. Right: Inferred cosmic evolution of the SFRD. Comparison with the literature includes measurements of ρSFR from UVLF from Harikane et al. (2022, 2023b), Donnan et al. (2023, 2024), Willott et al. (2024), Pérez-González et al. (2023), Bouwens et al. (2023a) and Bouwens et al. (2023b) or from IRLF by Zavala et al. (2021), as well as the compilation in Madau & Dickinson (2014). All are obtained using a common lower integration limit of the UVLF of MUV = −17, including Bouwens et al. (2023a,b) that we rescale using a factor of 0.5 dex. All points are converted to a Chabrier IMF. The ρSFR inferred from SMF measurements is also shown for a compilation of the most recent literature works (Ilbert et al. 2013; Stefanon et al. 2021; Weibel et al. 2024; Harvey et al. 2025) shown only for the best-fit function, without confidence intervals for clarity. The solid lines turn to transparent at lower z that are not probed in the corresponding work. The solid (dashed) black line and shaded region show the true (observed) SFRD from Behroozi et al. (2019). Our results indicate lower inferred SFRD at z < 3.5, in tension with instantaneous SFR indicators, while at z > 7.5 we find remarkable consistency with recent JWST UVLF results.
Current usage metrics show cumulative count of Article Views (full-text article views including HTML views, PDF and ePub downloads, according to the available data) and Abstracts Views on Vision4Press platform.
Data correspond to usage on the plateform after 2015. The current usage metrics is available 48-96 hours after online publication and is updated daily on week days.
Initial download of the metrics may take a while.