Fig. 11.
Download original image
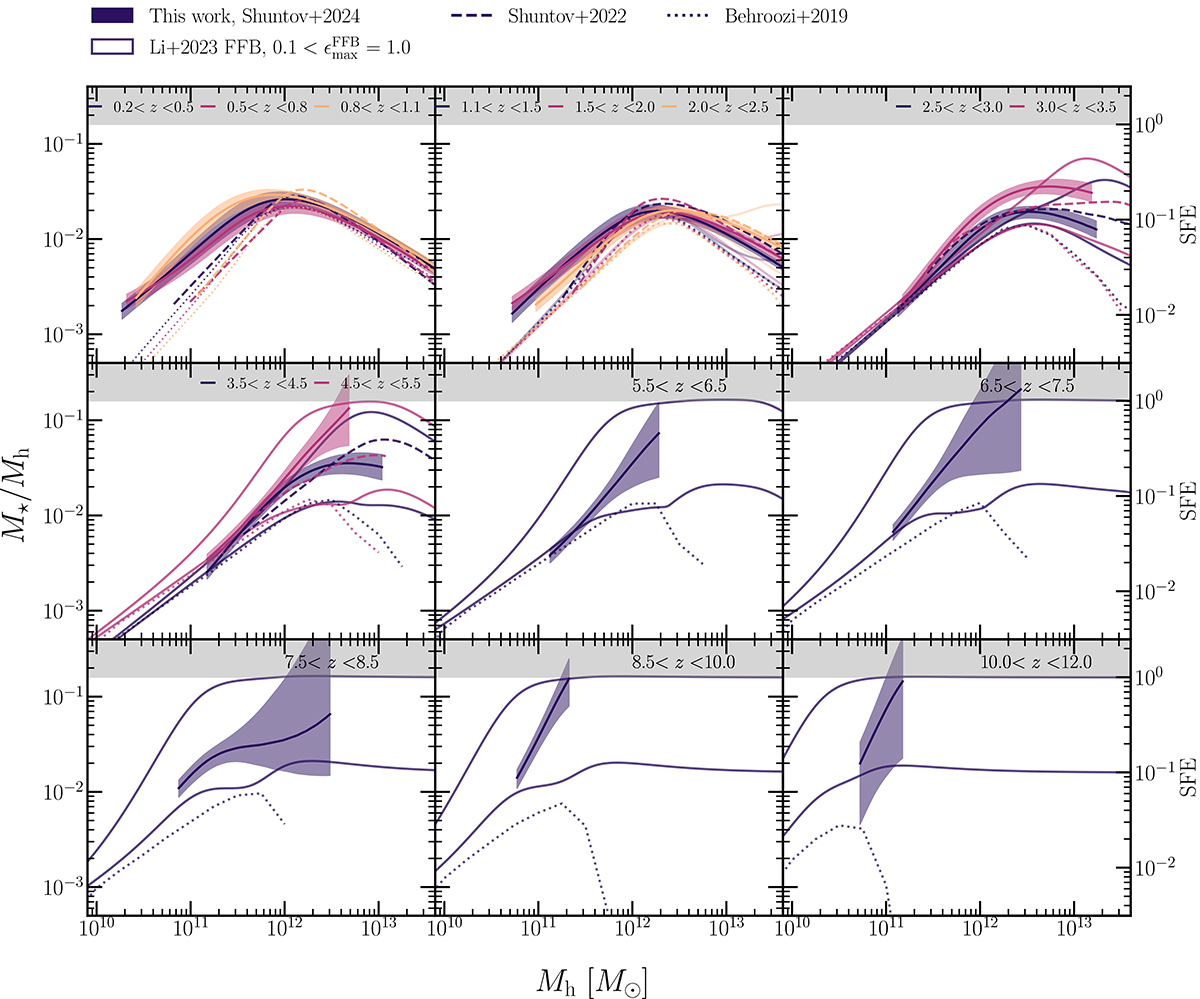
SHMR and the implied SFE in different redshift bins. The right axis indicates the SFE, ![]() , and the shaded gray region marks ϵ = 100%. Each panel shows the SHMR in several redshift bins from our work (solid lines with a 1σ uncertainty envelope), and literature works from Shuntov et al. (2022, dashed), Behroozi et al. (2019, dotted), and Stefanon et al. (2021, points). The FFB predictions from Li et al. (2024) are shown in the solid line envelope that encloses maximum SFE in the FFB regime in the 0.1 − 1.0 range.
, and the shaded gray region marks ϵ = 100%. Each panel shows the SHMR in several redshift bins from our work (solid lines with a 1σ uncertainty envelope), and literature works from Shuntov et al. (2022, dashed), Behroozi et al. (2019, dotted), and Stefanon et al. (2021, points). The FFB predictions from Li et al. (2024) are shown in the solid line envelope that encloses maximum SFE in the FFB regime in the 0.1 − 1.0 range.
Current usage metrics show cumulative count of Article Views (full-text article views including HTML views, PDF and ePub downloads, according to the available data) and Abstracts Views on Vision4Press platform.
Data correspond to usage on the plateform after 2015. The current usage metrics is available 48-96 hours after online publication and is updated daily on week days.
Initial download of the metrics may take a while.