Fig. 10.
Download original image
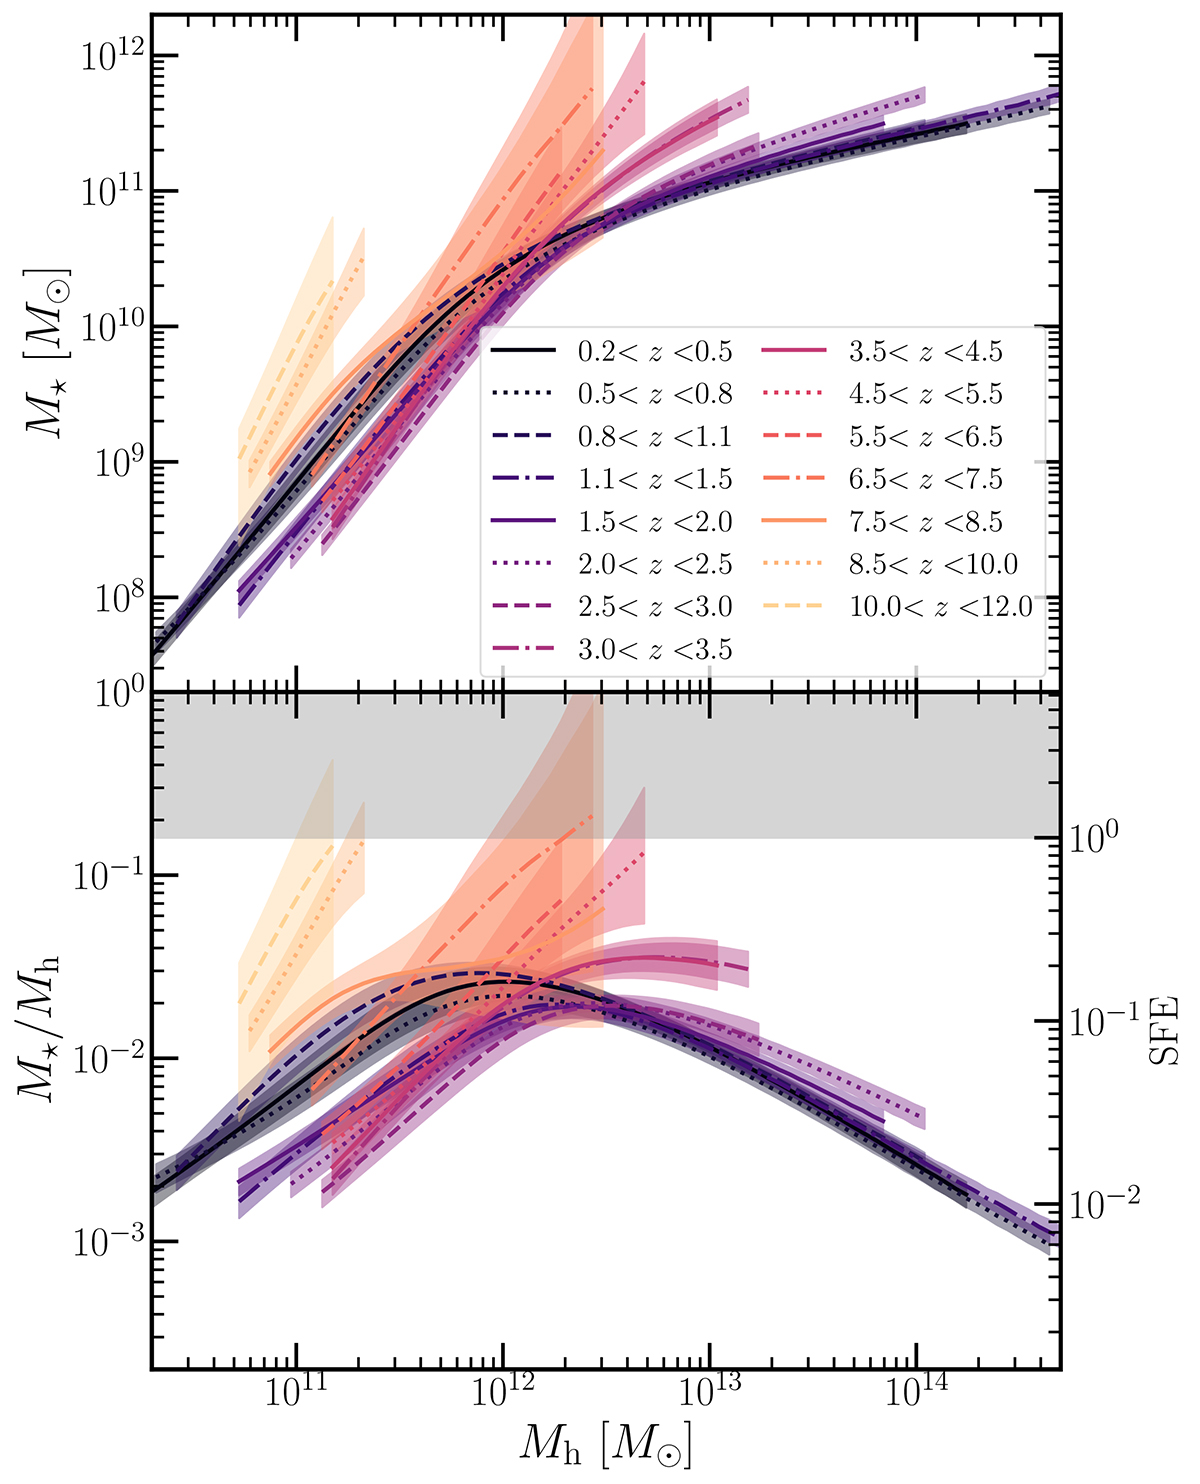
SHMR for each of the redshift bins in this work. This was obtained by doing abundance matching using the best-fit functional forms of the SMF and the HMF by Watson et al. (2013). The top panel shows stellar mass as a function of the inferred halo mass, while the bottom panel shows the ratio between the two as a function of halo mass. The right axis indicates the SFE, ![]() , and the shaded gray region marks ϵ⋆ ≥ 100%. The lines and their confidence intervals are shown only in the M⋆ range probed by our SMF measurements.
, and the shaded gray region marks ϵ⋆ ≥ 100%. The lines and their confidence intervals are shown only in the M⋆ range probed by our SMF measurements.
Current usage metrics show cumulative count of Article Views (full-text article views including HTML views, PDF and ePub downloads, according to the available data) and Abstracts Views on Vision4Press platform.
Data correspond to usage on the plateform after 2015. The current usage metrics is available 48-96 hours after online publication and is updated daily on week days.
Initial download of the metrics may take a while.