Fig. 6.
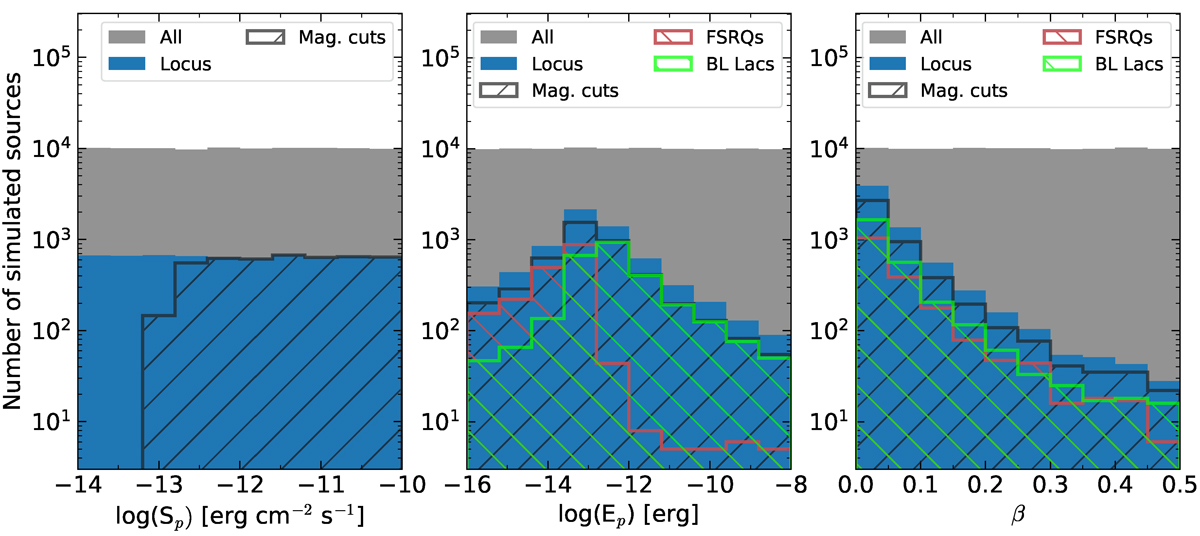
Download original image
Distribution of log-parabola parameters (from Eq. (2)) for 100 000 sources simulated with a model consisting of a log-parabola, an elliptical galaxy host, and a dust torus (grey histogram). We see that, overall, the sources within the blazar locus (blue histogram) present weak spectral curvature (β < 0.04 for 50% of the sample) and concentrate around Ep ≈ 1.5 × 10⁻¹³ erg. The black hatched histograms represent the blazar locus after we apply the WISE magnitude cuts and can be divided into two components, one with FSRQs (red histograms), and the other with BL Lacs (green histograms).
Current usage metrics show cumulative count of Article Views (full-text article views including HTML views, PDF and ePub downloads, according to the available data) and Abstracts Views on Vision4Press platform.
Data correspond to usage on the plateform after 2015. The current usage metrics is available 48-96 hours after online publication and is updated daily on week days.
Initial download of the metrics may take a while.