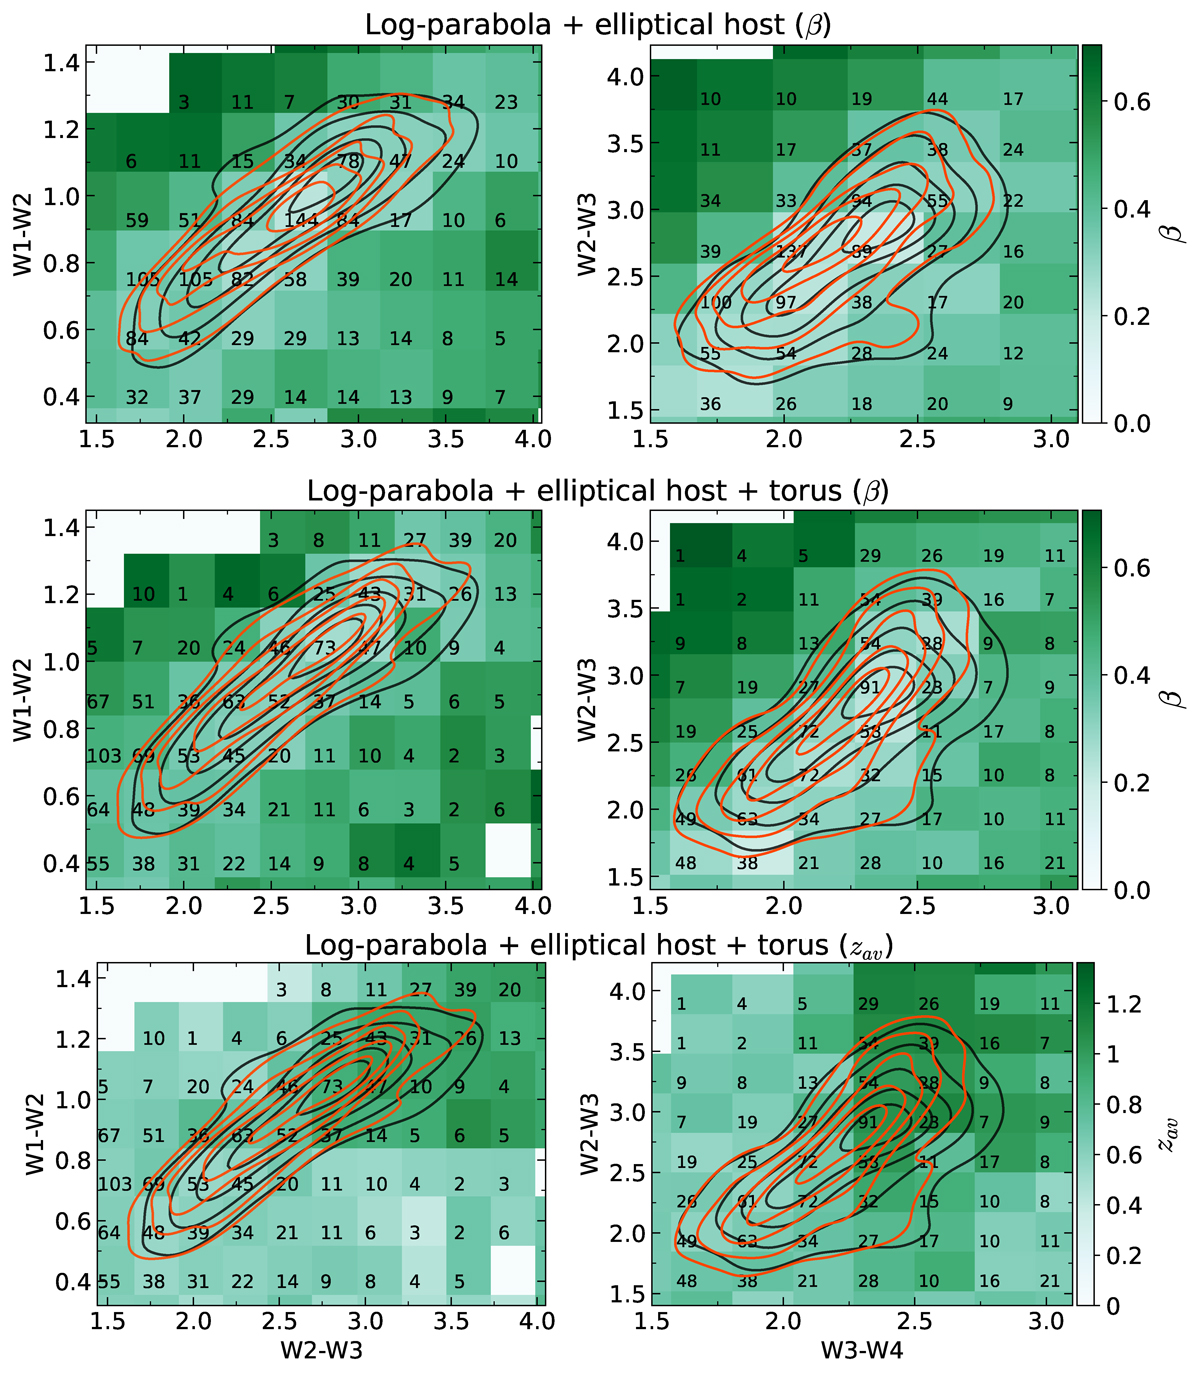
Fig. 4.
Download original image
Mid-infrared color-color diagrams for models consisting of a log-parabola and a host elliptical galaxy components (top panels), and the same model with the addition of a dust torus for the FSRQs (middle panels). The overall distribution of simulated sources within the locus (90% containment red contours) for this later model is in much better agreement with the original distribution of sources in the blazar locus (90% containment black contours) if compared with the previous models. In the bottom panels, we show how the average blazar redshift is distributed in our simulations (for the same model as in the middle panels), which agrees with Fig. 1. All of these panels represent only one simulation (out of ten) with 10 000 sources.
Current usage metrics show cumulative count of Article Views (full-text article views including HTML views, PDF and ePub downloads, according to the available data) and Abstracts Views on Vision4Press platform.
Data correspond to usage on the plateform after 2015. The current usage metrics is available 48-96 hours after online publication and is updated daily on week days.
Initial download of the metrics may take a while.