Fig. 3.
Download original image
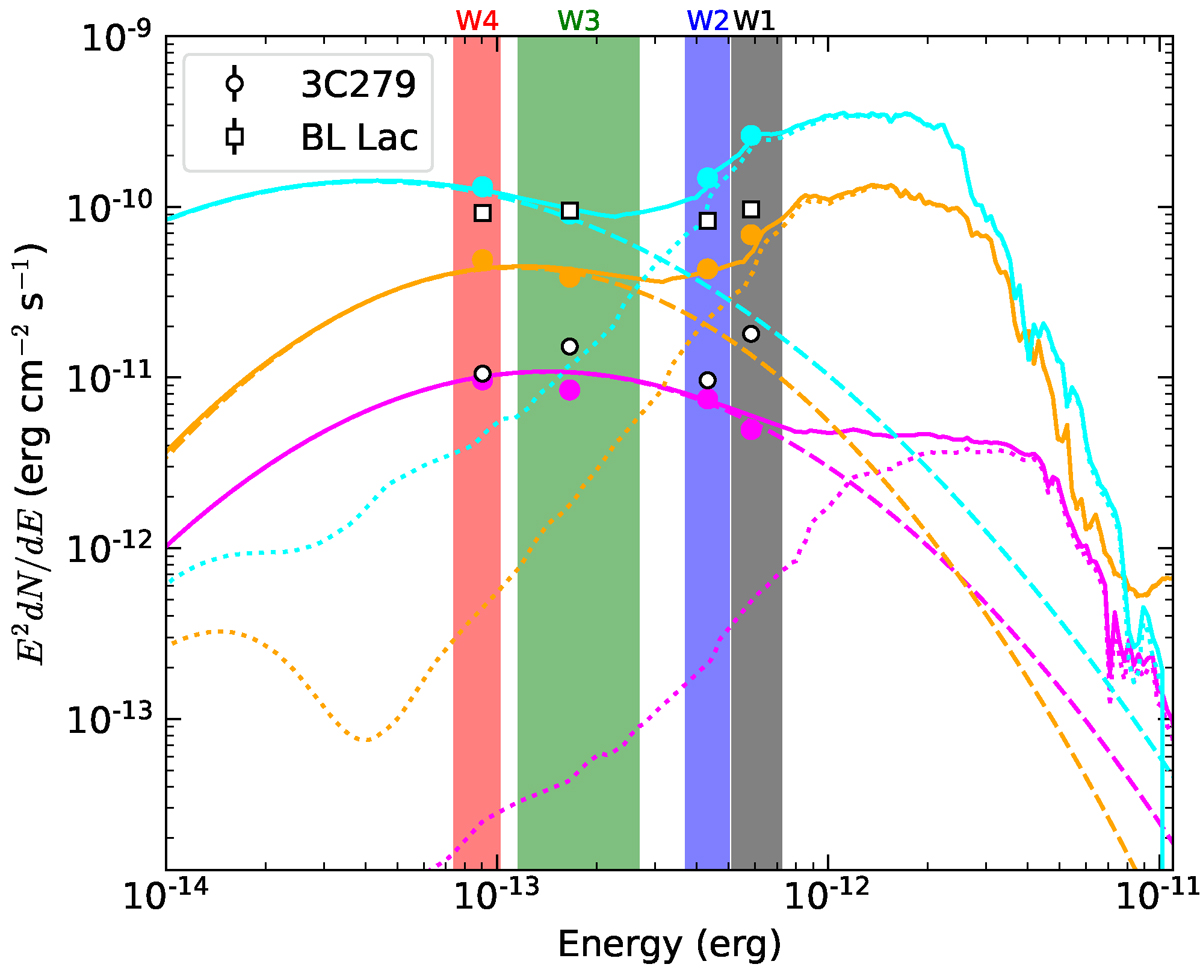
SEDs of three randomly chosen blazars from our simulations (each one represented by a specific color). The final SED from which we compute the magnitudes consists of the sum (solid lines) of a galactic (dotted lines) and a log-parabola (dashed lines) component. In the WISE bands (vertical-colored stripes) where the log-parabola component is relatively weak, we see a significant contribution from the host galaxy. The final differential fluxes (see text for details), including the 5% Gaussian noise, for each blazar in each band are shown as filled circles. For comparison, we also show the SED points measured with WISE for the blazars 3C279 and BL Lac, both of which are included in the locus sample.
Current usage metrics show cumulative count of Article Views (full-text article views including HTML views, PDF and ePub downloads, according to the available data) and Abstracts Views on Vision4Press platform.
Data correspond to usage on the plateform after 2015. The current usage metrics is available 48-96 hours after online publication and is updated daily on week days.
Initial download of the metrics may take a while.