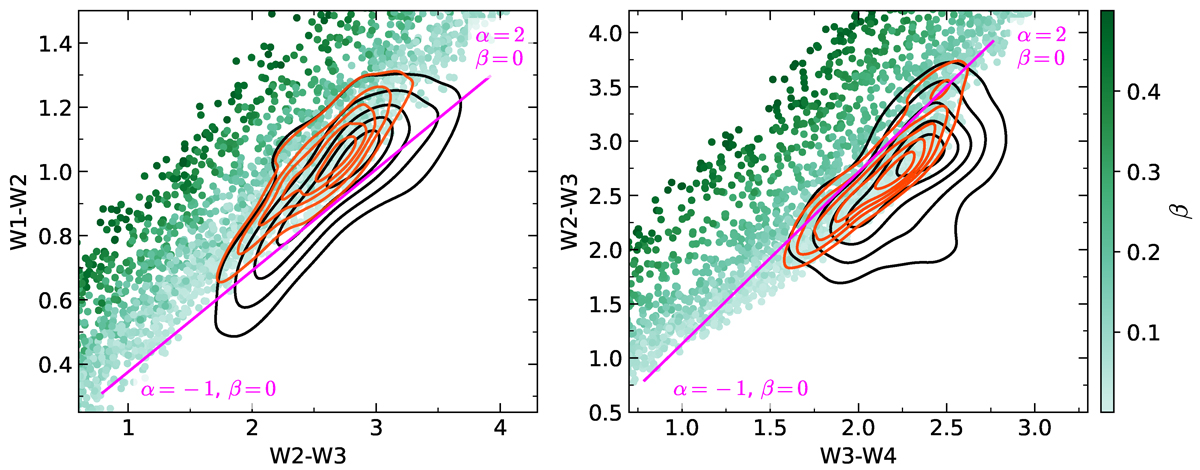
Fig. 2.
Download original image
Mid-infrared color-color diagrams for the log-parabola model. We see that this simplified model already seems to suggest that the blazar locus (represented by the three-dimensional color space delimited by the 90%-containment black contours from both panels) is populated by blazars with weak spectral curvature (i.e., relatively small values of β), although pure power-law spectra (magenta lines), with zero spectral curvature, also seem to be insufficient to create the observed distribution of sources in the locus. The red contours represent the 90% containment region for the simulated sources lying within the 90% containment contours of the blazar locus. The red and black isodensity contours are significantly different from each other, as detailed in the text. Here we plot only 5000 points for readability reasons.
Current usage metrics show cumulative count of Article Views (full-text article views including HTML views, PDF and ePub downloads, according to the available data) and Abstracts Views on Vision4Press platform.
Data correspond to usage on the plateform after 2015. The current usage metrics is available 48-96 hours after online publication and is updated daily on week days.
Initial download of the metrics may take a while.