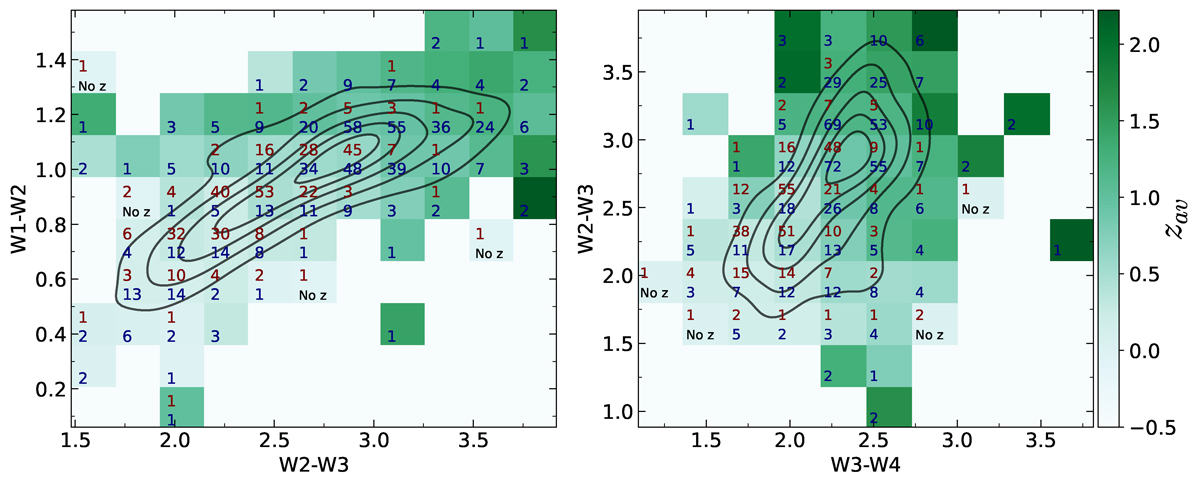
Fig. 1.
Download original image
Distribution of average redshift (green tiles) for the blazars used to create the locus. We see that the regions dominated by FSRQs (i.e., top-right corners of both panels) have higher average redshifts (zav). The dark-blue numbers within each tile represent the total number of sources used to compute the average redshift, while the brown numbers represent the number of blazars with unknown redshift. Tiles with no redshift available are set to 0 and tagged with the label “No z”, while the background tiles are set to −0.5. The black contours represent the 90% containment projections of the blazar locus in both mid-infrared color-color planes.
Current usage metrics show cumulative count of Article Views (full-text article views including HTML views, PDF and ePub downloads, according to the available data) and Abstracts Views on Vision4Press platform.
Data correspond to usage on the plateform after 2015. The current usage metrics is available 48-96 hours after online publication and is updated daily on week days.
Initial download of the metrics may take a while.