Fig. 5
Download original image
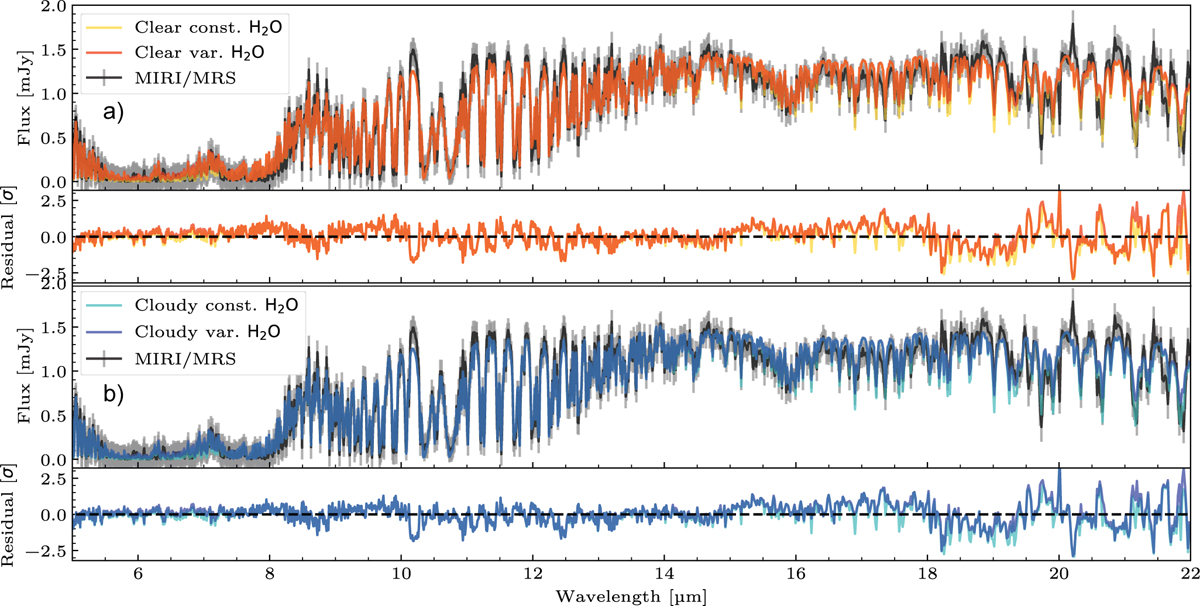
Effect of the water depletion on the spectrum. Panel a: comparison of the clear model with the constant water profile (in yellow) and the variable (in red) to the data (in black). Panel b: same but for the cloudy model with the constant profile (in cyan) and variable (in blue). In both panels, we use except for the profile parameters the retrieved values from the variable retrieval as well for the constant model.
Current usage metrics show cumulative count of Article Views (full-text article views including HTML views, PDF and ePub downloads, according to the available data) and Abstracts Views on Vision4Press platform.
Data correspond to usage on the plateform after 2015. The current usage metrics is available 48-96 hours after online publication and is updated daily on week days.
Initial download of the metrics may take a while.