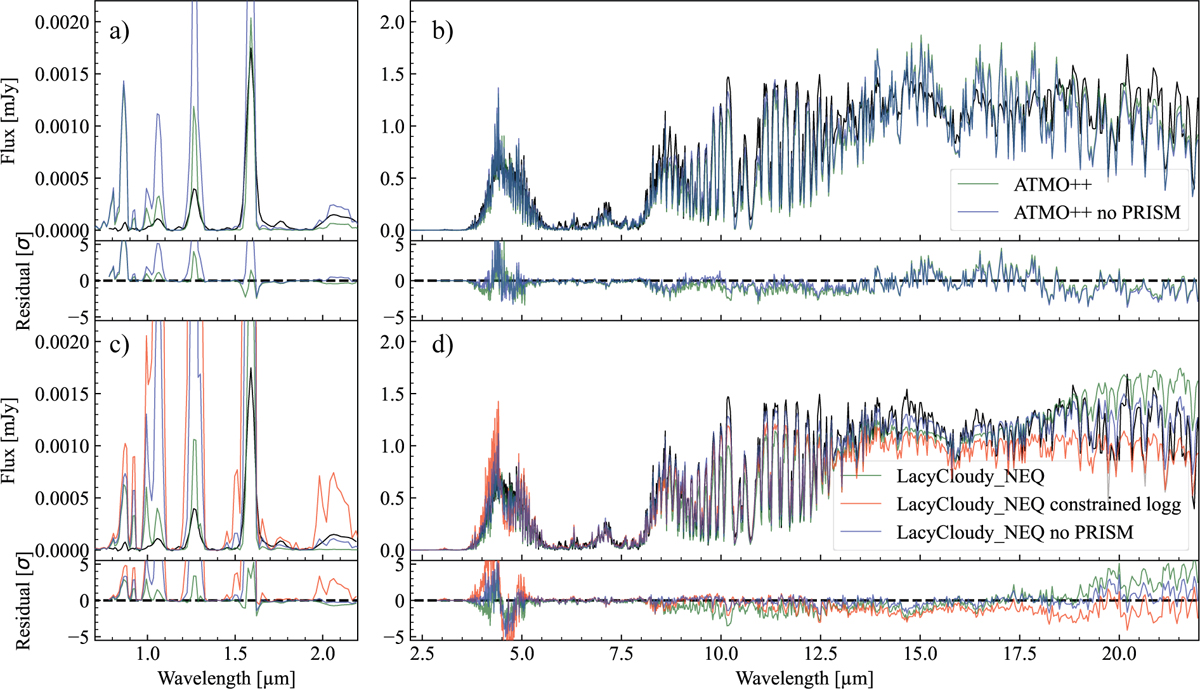
Fig. 12
Download original image
Grid model comparison for ATMO++ (a and b) and Lacy Cloudy non-equilibrium (c and d) if we fit the whole spectrum (green) versus neglecting the NIRSpec/PRISM and photometry data (blue) versus constraining the whole spectrum to log(g) between 4.0 and 5.0 (red). In the case for ATMO++ the grid model results do not change if we only constrain the surface gravity and thus we only show the comparison to the neglected NIRSpec/PRISM data.
Current usage metrics show cumulative count of Article Views (full-text article views including HTML views, PDF and ePub downloads, according to the available data) and Abstracts Views on Vision4Press platform.
Data correspond to usage on the plateform after 2015. The current usage metrics is available 48-96 hours after online publication and is updated daily on week days.
Initial download of the metrics may take a while.