Open Access
Fig. 8.
Download original image
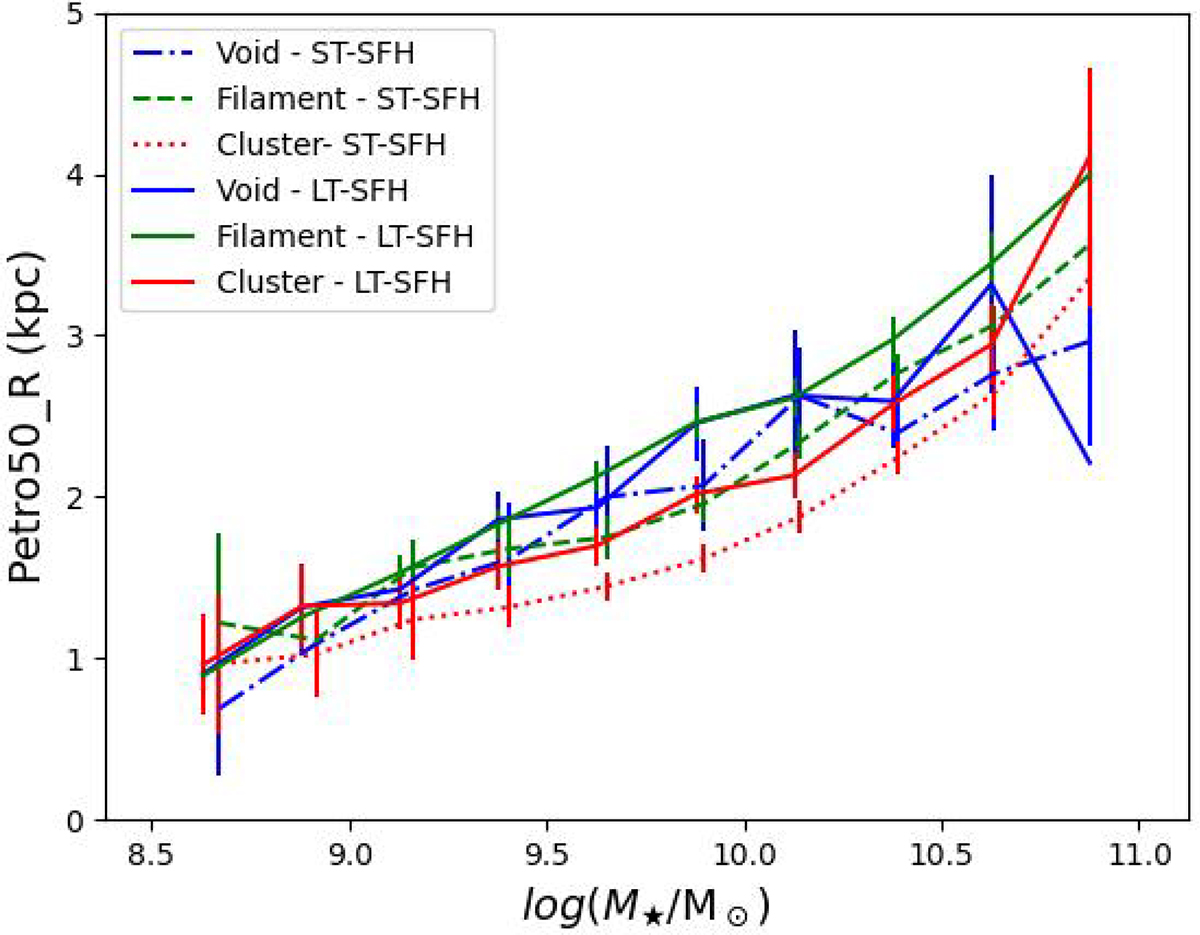
Plot shows the mean stellar mass-size relation, using the Petrosian R50, for galaxies with short-timescale (ST-SFH) and long-timescale star formation histories (LT-SFH). Void galaxies are represented in blue, filament galaxies in green, and cluster galaxies in red.
Current usage metrics show cumulative count of Article Views (full-text article views including HTML views, PDF and ePub downloads, according to the available data) and Abstracts Views on Vision4Press platform.
Data correspond to usage on the plateform after 2015. The current usage metrics is available 48-96 hours after online publication and is updated daily on week days.
Initial download of the metrics may take a while.