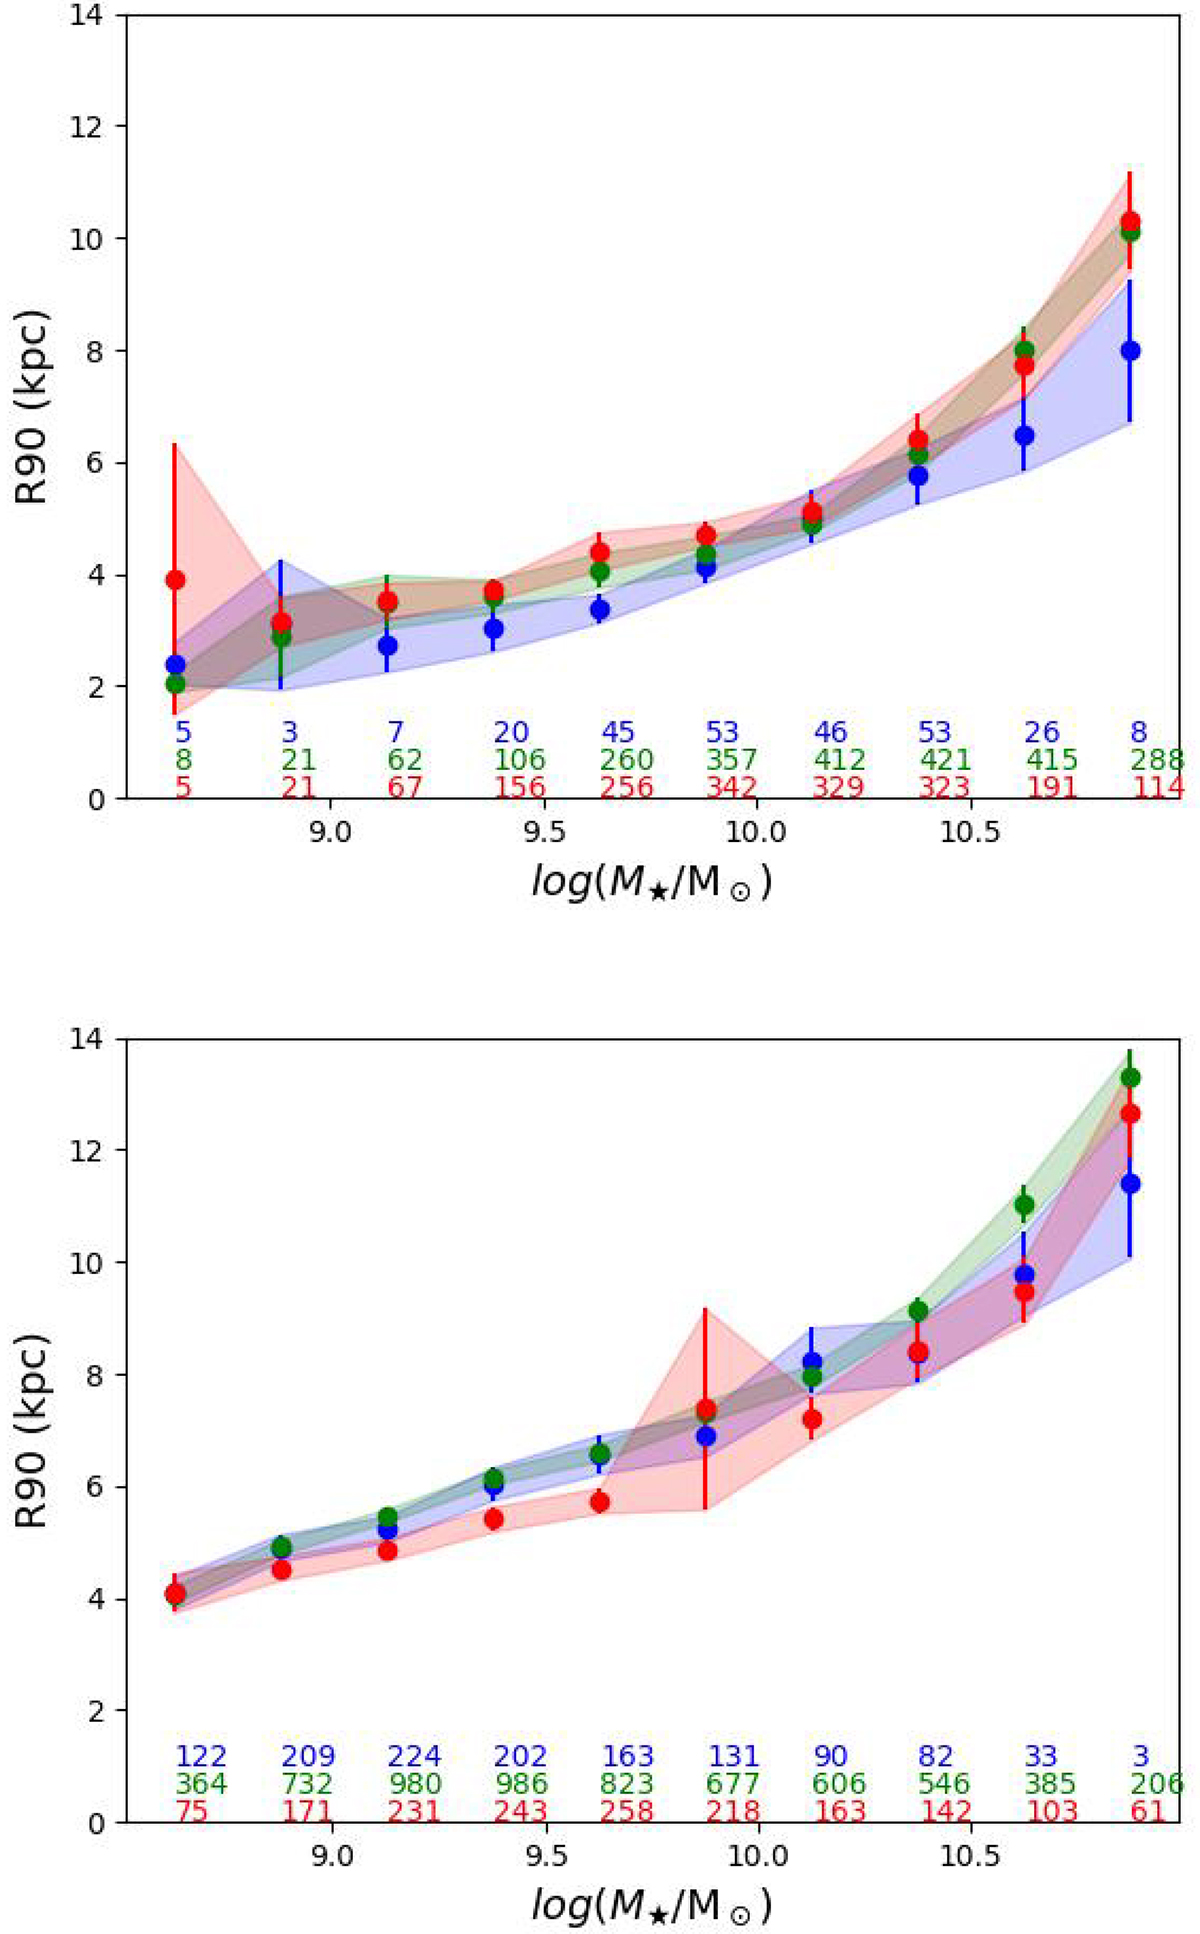
Fig. 5.
Download original image
Plots displaying the mean values of the Petrosian R90 for early-type galaxies (top panel) and late-type galaxies (bottom panel) across different large-scale environments and mass bins. Void galaxies are shown in blue, filament galaxies in green, and cluster galaxies in red. The number of galaxies in each mass bin is indicated at the bottom of each panel.
Current usage metrics show cumulative count of Article Views (full-text article views including HTML views, PDF and ePub downloads, according to the available data) and Abstracts Views on Vision4Press platform.
Data correspond to usage on the plateform after 2015. The current usage metrics is available 48-96 hours after online publication and is updated daily on week days.
Initial download of the metrics may take a while.