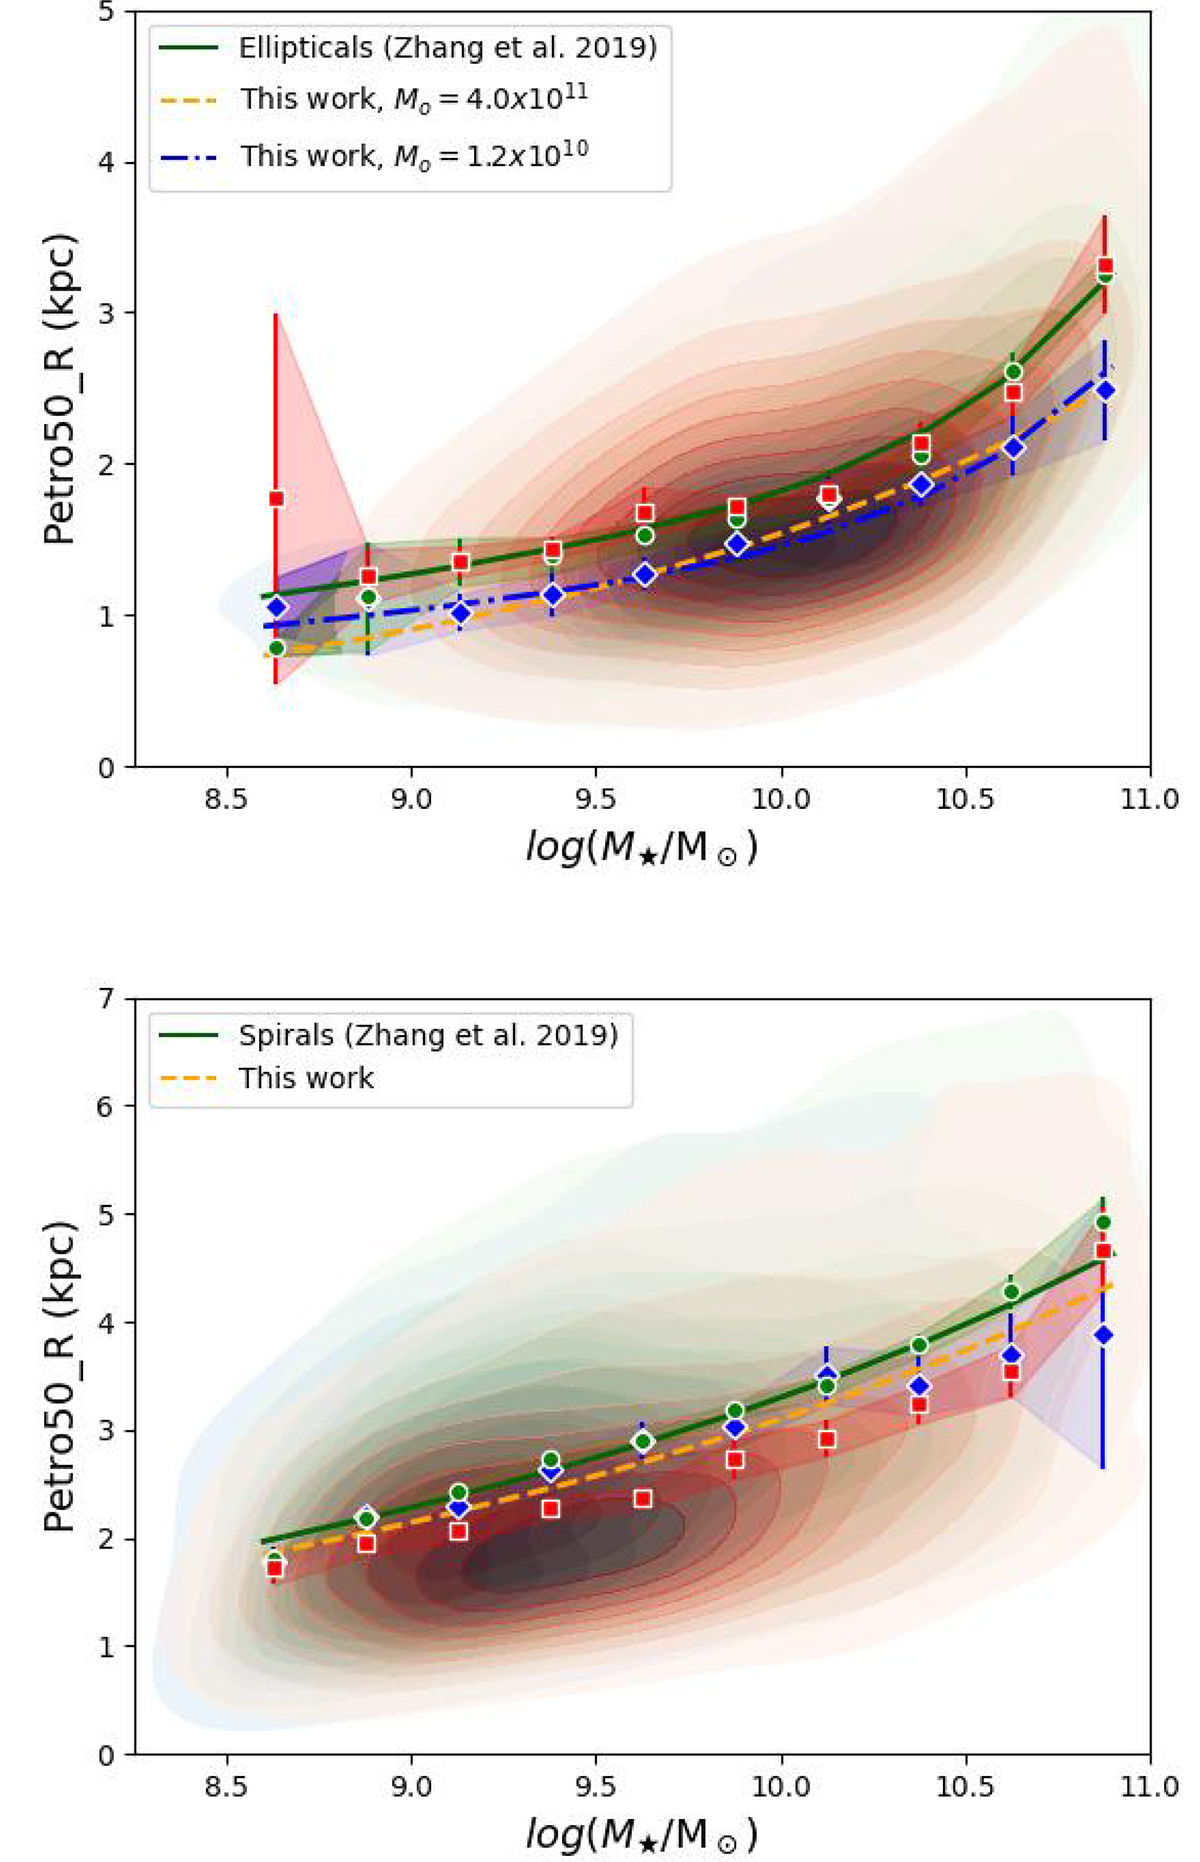
Fig. 4.
Download original image
Plot displaying the density and mean values of the Petrosian R50 for early-type galaxies (top panel) and late-type galaxies (bottom panel) across various large-scale environments. Void galaxies are represented in blue, filament galaxies in green, and cluster galaxies in red. For comparison, the green solid lines show the fits from Zhang & Yang (2019). In the top panel, the best-fit parameters to the void galaxies are displayed, with blue and orange solid lines in the top panel and an orange solid line in the bottom panel, corresponding to the fitted parameters detailed in Table 1, as discussed in the text.
Current usage metrics show cumulative count of Article Views (full-text article views including HTML views, PDF and ePub downloads, according to the available data) and Abstracts Views on Vision4Press platform.
Data correspond to usage on the plateform after 2015. The current usage metrics is available 48-96 hours after online publication and is updated daily on week days.
Initial download of the metrics may take a while.