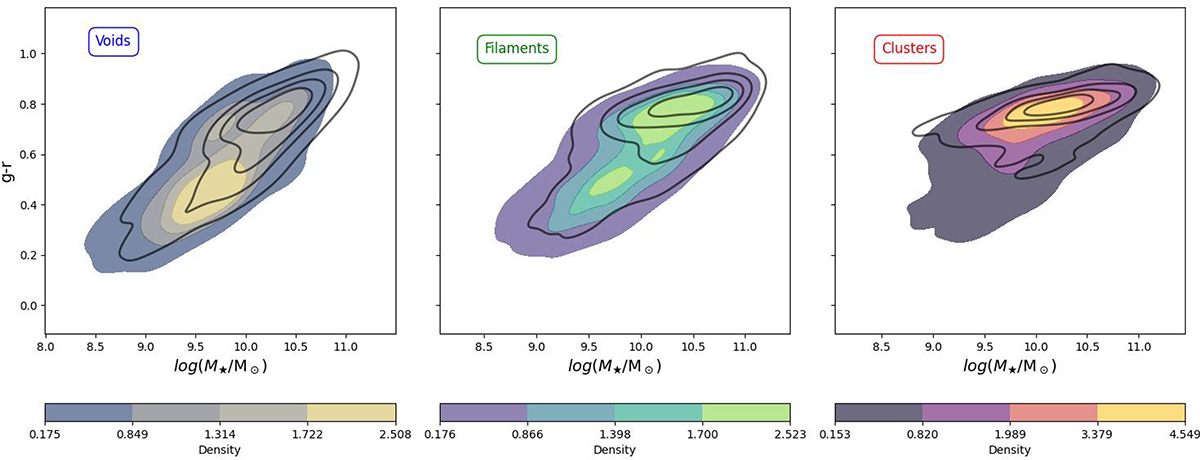
Fig. 2.
Download original image
Colour-magnitude diagram for the sample galaxies in the different large-scale environments. The plots show the normalised density of galaxies. The colourbar provides a normalised scale for these density values across the sub-plots. A distinction between LT-SFH and ST-SFH galaxies has been made, with the coloured density maps representing the distributions for LT-SFH systems and the solid contours the density maps for ST-SFH galaxies. Left panel shows voids, central panel shows filaments, and right panel shows cluster galaxies.
Current usage metrics show cumulative count of Article Views (full-text article views including HTML views, PDF and ePub downloads, according to the available data) and Abstracts Views on Vision4Press platform.
Data correspond to usage on the plateform after 2015. The current usage metrics is available 48-96 hours after online publication and is updated daily on week days.
Initial download of the metrics may take a while.