Open Access
Fig. 10.
Download original image
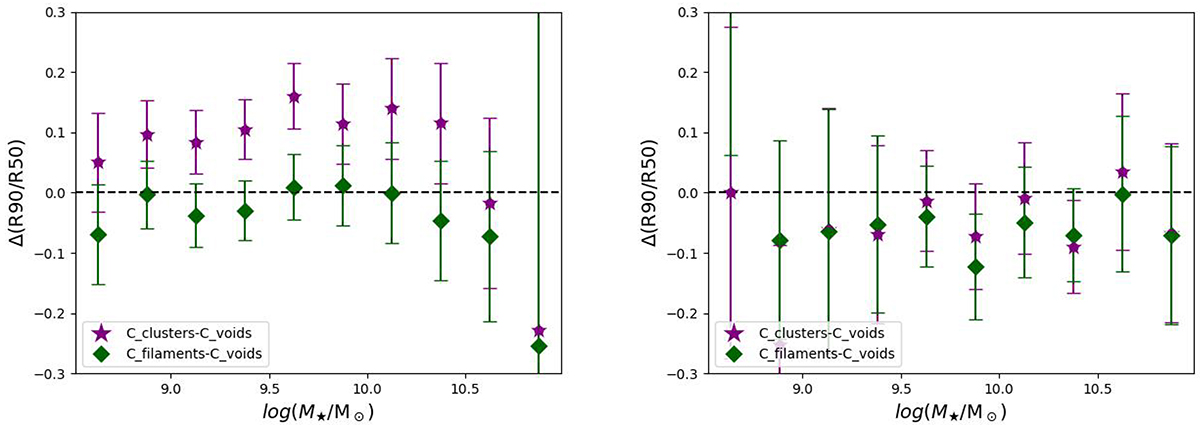
Plots displaying the difference in the mean concentration ratio (C), defined as R90/R50, at different mass bins between filament and cluster galaxies in comparison to void galaxies. The left panel illustrates this difference for late-type galaxies, while the right panel presents the comparison for early-type galaxies.
Current usage metrics show cumulative count of Article Views (full-text article views including HTML views, PDF and ePub downloads, according to the available data) and Abstracts Views on Vision4Press platform.
Data correspond to usage on the plateform after 2015. The current usage metrics is available 48-96 hours after online publication and is updated daily on week days.
Initial download of the metrics may take a while.