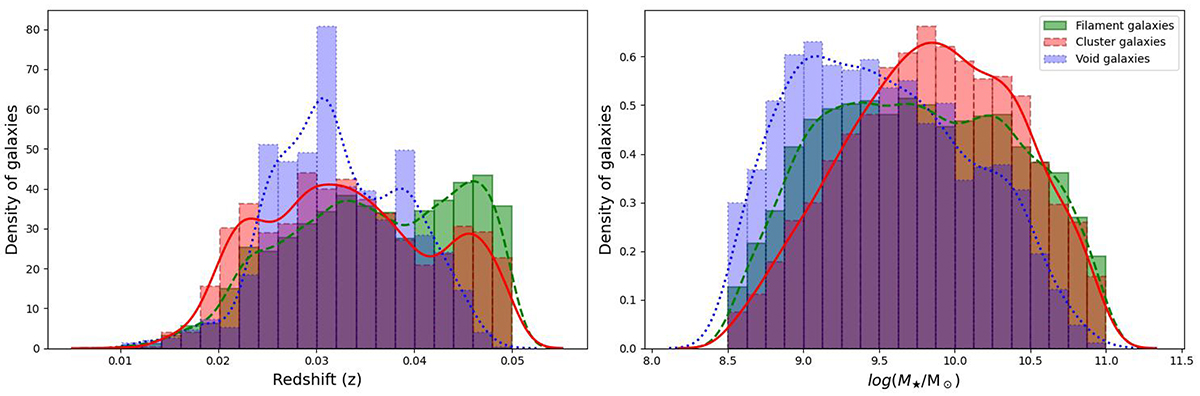
Fig. 1.
Download original image
Distribution of stellar mass log(M⋆/M⊙) in the right panel and redshift in the left panel for galaxies in voids, filaments, and clusters. Histograms represent the normalised density of galaxies in each large-scale environment, with distinct colors and transparencies for void galaxies (blue), filament galaxies (green), and cluster galaxies (red). The kernel density estimation (KDE) plots overlay the histograms to show smoothed distributions. The comparison of the stellar mass distribution highlights that void galaxies tend to populate lower mass ranges, while the filament and cluster galaxies extend to higher masses.
Current usage metrics show cumulative count of Article Views (full-text article views including HTML views, PDF and ePub downloads, according to the available data) and Abstracts Views on Vision4Press platform.
Data correspond to usage on the plateform after 2015. The current usage metrics is available 48-96 hours after online publication and is updated daily on week days.
Initial download of the metrics may take a while.