Open Access
Fig. 8
Download original image
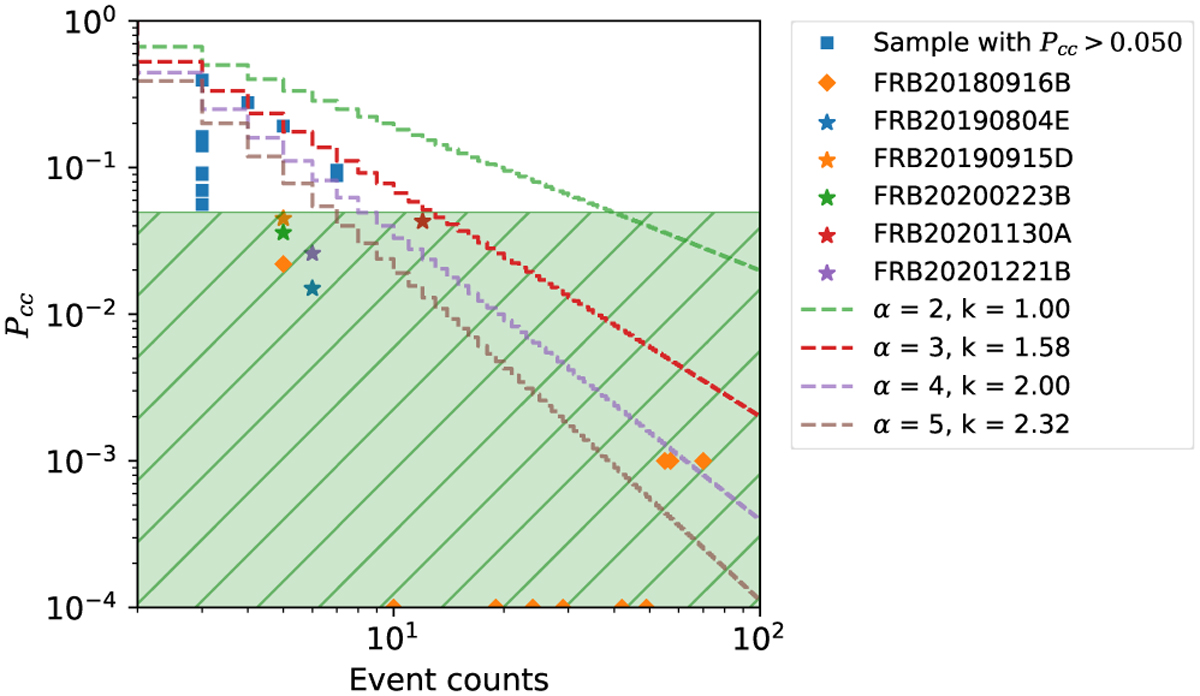
Probability of chance coincidence of evaluated period plotted against the event counts of the FRB. Points along the bottom line of the y-axis show values below the graph limit.
Current usage metrics show cumulative count of Article Views (full-text article views including HTML views, PDF and ePub downloads, according to the available data) and Abstracts Views on Vision4Press platform.
Data correspond to usage on the plateform after 2015. The current usage metrics is available 48-96 hours after online publication and is updated daily on week days.
Initial download of the metrics may take a while.