Fig. 7
Download original image
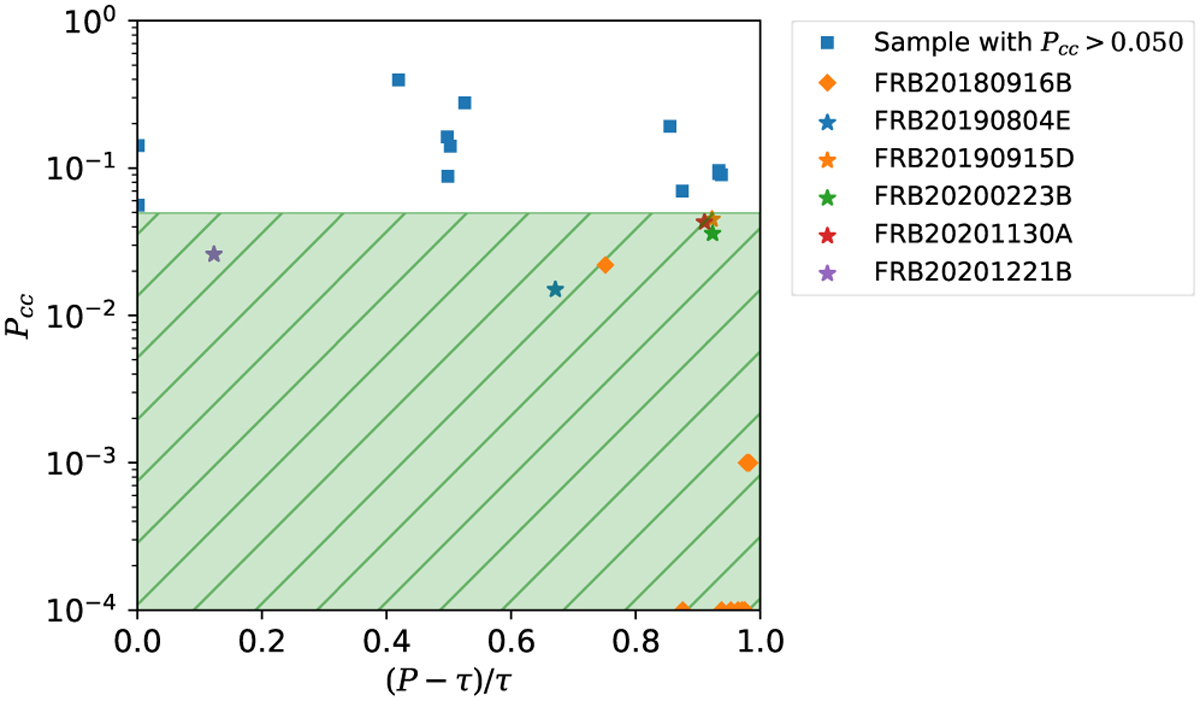
Probability of chance coincidence plotted against relative difference of period from event window for our sample with values from FRB 20180916B as reference. The various plot points for FRB 20180916B represent the values from different sub-windows. Points at the bottom line indicate probability values lower than the graph limit.
Current usage metrics show cumulative count of Article Views (full-text article views including HTML views, PDF and ePub downloads, according to the available data) and Abstracts Views on Vision4Press platform.
Data correspond to usage on the plateform after 2015. The current usage metrics is available 48-96 hours after online publication and is updated daily on week days.
Initial download of the metrics may take a while.