Open Access
Fig. 3
Download original image
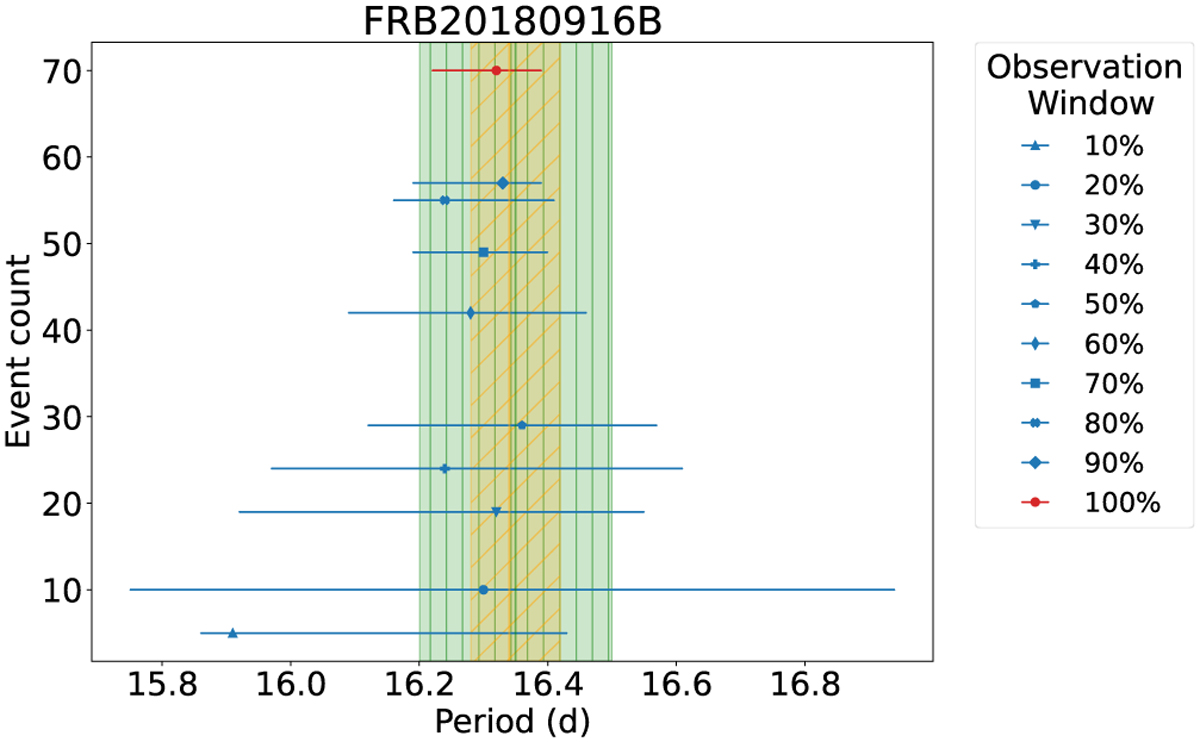
Event count plotted against evaluated periods for FRB 20180916B with limited observation window. The 100% window is coloured red to highlight the result from a full dataset. The green vertical hatch and the orange diagonal hatch represent period ranges from Amiri et al. (2020) and Sand et al. (2023), respectively.
Current usage metrics show cumulative count of Article Views (full-text article views including HTML views, PDF and ePub downloads, according to the available data) and Abstracts Views on Vision4Press platform.
Data correspond to usage on the plateform after 2015. The current usage metrics is available 48-96 hours after online publication and is updated daily on week days.
Initial download of the metrics may take a while.